Flying is a highly controversial topic in climate debates. There are a few reasons for this.
The first is the disconnect between its role in our personal and collective carbon emissions. Air travel dominates frequent travellers’ individual contributions to climate change. Yet aviation overall accounts for only 2.5% of global carbon dioxide (CO2) emissions. This is because there are large inequalities in how much people fly – many do not, or cannot afford to, fly at all [best estimates put this figure at around 80% of the world population – we will look at this in more detail in an upcoming article].
The second is how aviation emissions are attributed to countries. CO2 emissions from domestic flights are counted in a country’s emission accounts. International flights are not – instead they are counted as their own category: ‘bunker fuels’. The fact that they don’t count towards the emissions of any country means there are few incentives for countries to reduce them.
It’s also important to note that unlike the most common greenhouse gases – carbon dioxide, methane or nitrous oxide – non-CO2 forcings from aviation are not included in the Paris Agreement. This means they could be easily overlooked – especially since international aviation is not counted within any country’s emissions inventories or targets.
How much of a role does aviation play in global emissions and climate change? In this article we take a look at the key numbers that are useful to know.
Global aviation (including domestic and international; passenger and freight) accounts for:
3.5% of ‘radiative forcing’. Radiative forcing measures the difference between incoming energy and the energy radiated back to space. If more energy is absorbed than radiated, the atmosphere becomes warmer.
The latter two numbers refer to 2018, and the first to 2016, the latest year for which such data are available.
Aviation accounts for 2.5% of global CO2 emissions
As we will see later in this article, there are a number of processes by which aviation contributes to climate change. But the one that gets the most attention is its contribution via CO2 emissions. Most flights are powered by jet gasoline – although some partially run on biofuels – which is converted to CO2 when burned.
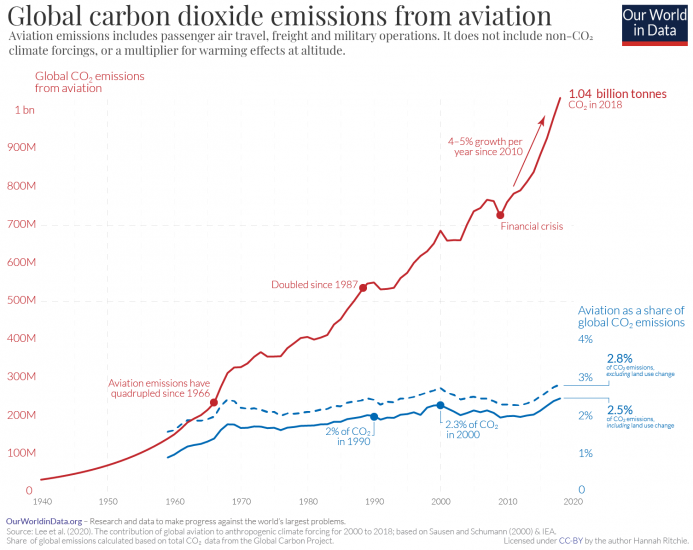
In a recent paper, researchers – David Lee and colleagues – reconstructed annual CO2 emissions from global aviation dating back to 1940.1 This was calculated based on fuel consumption data from the International Energy Agency (IEA), and earlier estimates from Robert Sausen and Ulrich Schumann (2000).2
The time series of global emissions from aviation since 1940 is shown in the accompanying chart. In 2018, it’s estimated that global aviation – which includes both passenger and freight – emitted 1.04 billion tonnes of CO2.
Aviation emissions have doubled since the mid-1980s. But, they’ve been growing at a similar rate as total CO2 emissions – this means its share of global emissions has been relatively stable: in the range of 2% to 2.5%.5
Non-CO2 climate impacts mean aviation accounts for 3.5% of global warming
Aviation accounts for around 2.5% of global CO2 emissions, but it’s overall contribution to climate change is higher. This is because air travel does not only emit CO2: it affects the climate in a number of more complex ways.
As well as emitting CO2 from burning fuel, planes affect the concentration of other gases and pollutants in the atmosphere. They result in a short-term decrease, but long-term increase in ozone (O3); a decrease in methane (CH4); emissions of water vapour; soot; sulfur aerosols; and water contrails. While some of these impacts result in warming, while others induce a cooling effect. Overall, the warming effect is stronger.
David Lee et al. (2020) quantified the overall effect of aviation on global warming when all of these impacts were included.6 To do this they calculated the so-called ‘Radiative Forcing’. Radiative forcing measures the difference between incoming energy and the energy radiated back to space. If more energy is absorbed than radiated, the atmosphere becomes warmer.
In this chart we see their estimates for the radiative forcing of the different elements. When we combine them, aviation accounts for approximately 3.5% of net radiative forcing: that is, 3.5% of warming.
Although CO2 gets most of the attention, it accounts for less than half of this warming. Two-thirds (66%) comes from non-CO2 forcings. Contrails – water vapor trails from aircraft exhausts – account for the largest share.
We don’t yet have the technologies to decarbonize air travel
Aviation’s contribution to climate change – 3.5% of warming, or 2.5% of CO2 emissions – is often less than people think. It’s currently a relatively small chunk of emissions compared to other sectors.
The key challenge is that it is particularly hard to decarbonize. We have solutions to reduce emissions for many of the largest emitters – such as power or road transport – and it’s now a matter of scaling them. We can deploy renewable and nuclear energy technologies, and transition to electric cars. But we don’t have proven solutions to tackle aviation yet.
There are some design concepts emerging – Airbus, for example, have announced plans to have the first zero-emission aircraft by 2035, using hydrogen fuel cells. Electric planes may be a viable concept, but are likely to be limited to very small aircraft due to the limitations of battery technologies and capacity.
Innovative solutions may be on the horizon, but they’re likely to be far in the distance.
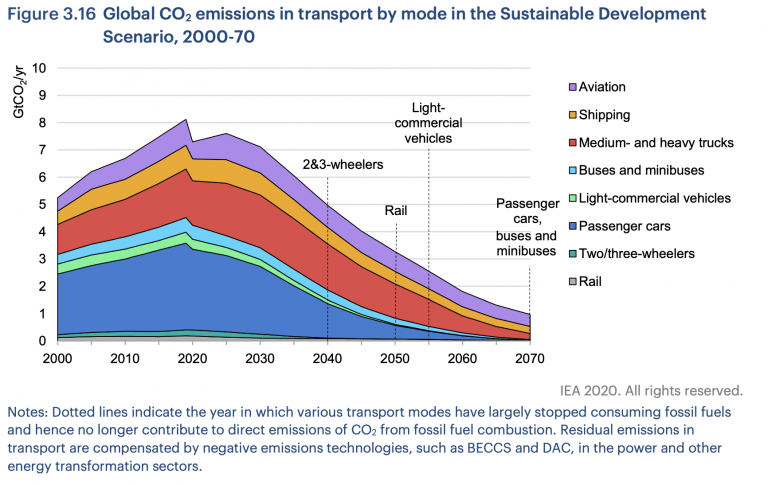
Towards zero-carbon transport: how can we expect the sector’s CO2 emissions to change in the future?
Appendix: Efficiency improvements means air traffic has increased more rapidly than emissions
Global emissions from aviation have increased a lot over the past half-century. However, air travel volumes increased even more rapidly.
Since 1950, aviation emissions increased almost seven-fold; since 1960 they’ve tripled. Air traffic volume – here defined as revenue passenger kilometers (RPK) traveled – increased by orders of magnitude more: almost 300-fold since 1950; and 75-fold since 1960 [you find this data in our interactive chart here].7
The much slower growth in emissions means aviation efficiency has seen massive improvements. In the chart we show both the increase in global airline traffic since 1950, and aviation efficiency, measured as the quantity of CO2 emitted per revenue passenger kilometer traveled. In 2018, approximately 125 grams of CO2 were emitted per RPK. In 1960, this was eleven-fold higher; in 1950 it was twenty-fold higher. Aviation has seen massive efficiency improvements over the past 50 years.
These improvements have come from several sources: improvements in the design and technology of aircraft; larger aircraft sizes (allowing for more passengers per flight); and an increase in how ‘full’ passenger flights are. This last metric is termed the ‘passenger load factor’. The passenger load factor measures the actual number of kilometers traveled by paying customers (RPK) as a percentage of the available seat kilometers (ASK) – the kilometers traveled if every plane was full. If every plane was full the passenger load factor would be 100%. If only three-quarters of the seats were filled, it would be 75%.
The global passenger load factor increased from 61% in 1950 to 82% in 2018 [you find this data in our interactive chart here].

