The team at NASA made three animations, all showing the carbon dioxide levels throughout the year 2021. Each one shows four major contributors: fossil fuels, burning biomass, land ecosystems, and the oceans. In the view showing North and South America, we can see the results of plants absorbing the gas via photosynthesis and then releasing it during winter months. There are intense contributions along the northeastern seaboard of the U.S. mainly by emissions from fossil fuels burning. There’s also a rise and fall of the gas over the Amazon rainforest. The team also interprets this as plants absorbing carbon during the day and then releasing it at night.
Carbon dioxide measurements over North and South America in 2021. NASA’s Scientific Visualization Studio [NB: for the impatient, skip forward through the videos to see how fast this stuff is covering more and more of the planet]
The animations also show sources and sinks (where CO2 is absorbed) in Asia and show an incredible amount of fossil fuel emissions over China. In other parts of the world, such as Australia, the absorption of this gas is much higher, with lower emissions due to lower populations.
This greenhouse-induced climate change is a complex process to study, but it’s clear that carbon dioxide is part of it. There are two sources of it here on Earth: natural and human-caused. Natural CO2 sources provide most of this gas released into the atmosphere. These include oceans, animal and plant respiration, decomposition of organic matter, forest fires, and volcanic eruptions. Scientists know of some naturally occurring CO2 deposits in Earth’s crust that could also serve as CO2 sources. There are also “sinks”, where the gas gets trapped for some period of time. The oceans, (particularly the southern ocean), soil, and forests all “suck it in”, along with other plants. Those same sinks can release their stores of this gas.
Human-caused (or “anthropogenic”) sources include power generation, chemical production, agricultural practices, and transportation. Note that most of these involve fossil fuel burning. Fossil fuels are natural gas, coal, and oil.
How CO2 Cycles Over Time
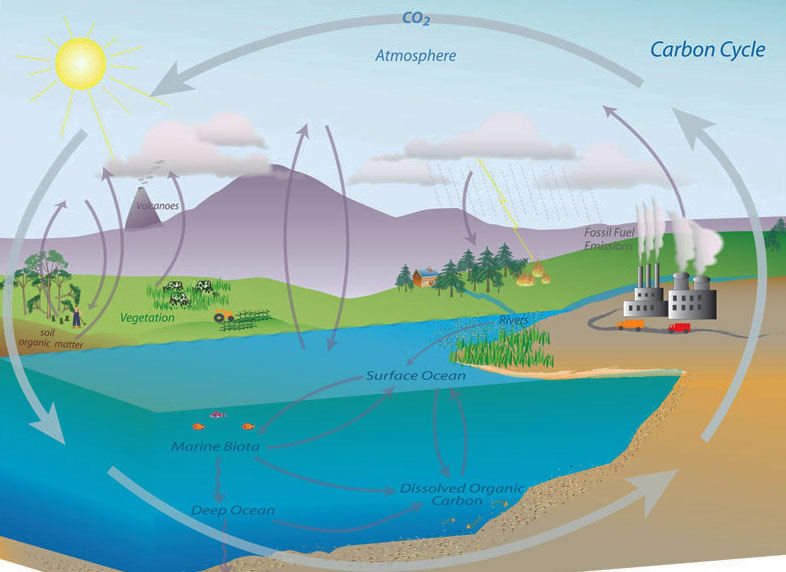
The carbon cycle, which helps trace carbon dioxide on Earth. Courtesy: NOAA
So, we know that carbon dioxide goes through a natural “cycle” where it is exchanged in the air, ground, oceans, plants, humans, and animals. Throughout most of history, this cycle kept the seasonal average of CO2 in the atmosphere around an estimated 280 parts per million (ppm). In modern times, fossil fuel burning and other human activities added more CO2 to the cycle and changed the amount of it in the atmosphere. That pace has accelerated to the point where the levels are up by 50% in less than 200 years. Today the amount of CO2 is around 441 ppm and it continues to rise as we pump more of the gas into the air. Climatologists predict that as it rises, the average global temperature will continue to rise along with it.
If we look at average global temperatures since historical measurements began (when we were pumping less CO2 into the air), Earth’s temperature has risen about 0.08 C (0.14 F) each decade. Natural variability plays some role, but the addition of more carbon dioxide plays an increasing role. Over time, heating has added up to a 2-degree rise over more than a century. It tracks with the increasing amounts of this gas in our air. Two degrees is a lot; even one degree is enough to cause significant effects. To give you an idea, in the distant past, when global averages dropped by a degree or two, Earth suffered what’s called the Little Ice Age.
Warming Drives Change
A chart showing how global temperatures changed from 1880 to 2020. Courtesy MET Office Hadley Centre/Climactic Research Unit.
It may not sound like much, but two degrees is enough to drive change in our weather patterns, water cycles, and other environmental processes. That gradual warming is why experts often refer to “global warming”. It’s not that everywhere gets hot at once. It means that the average annual air temperature is rising. To give you an idea, the year 2022 was the sixth warmest year since people began keeping global records in 1880.
Maps and animations of CO2 sources, sinks, and cycles like the ones from NASA satellite data show in stark detail the cycle of this particular gas. The idea is to help people understand visually and intellectually what changes our atmosphere experiences over time.