
Right now, in the Netherlands there is talk about reducing the speed limit from 130kph to 100kph in order to comply to emissions goals set by the EU (and supported by NL) years ago. Because NL didn’t put into effect any necessary legislation years ago, this is now coming to bite NL in the arse and they are playing panic football.
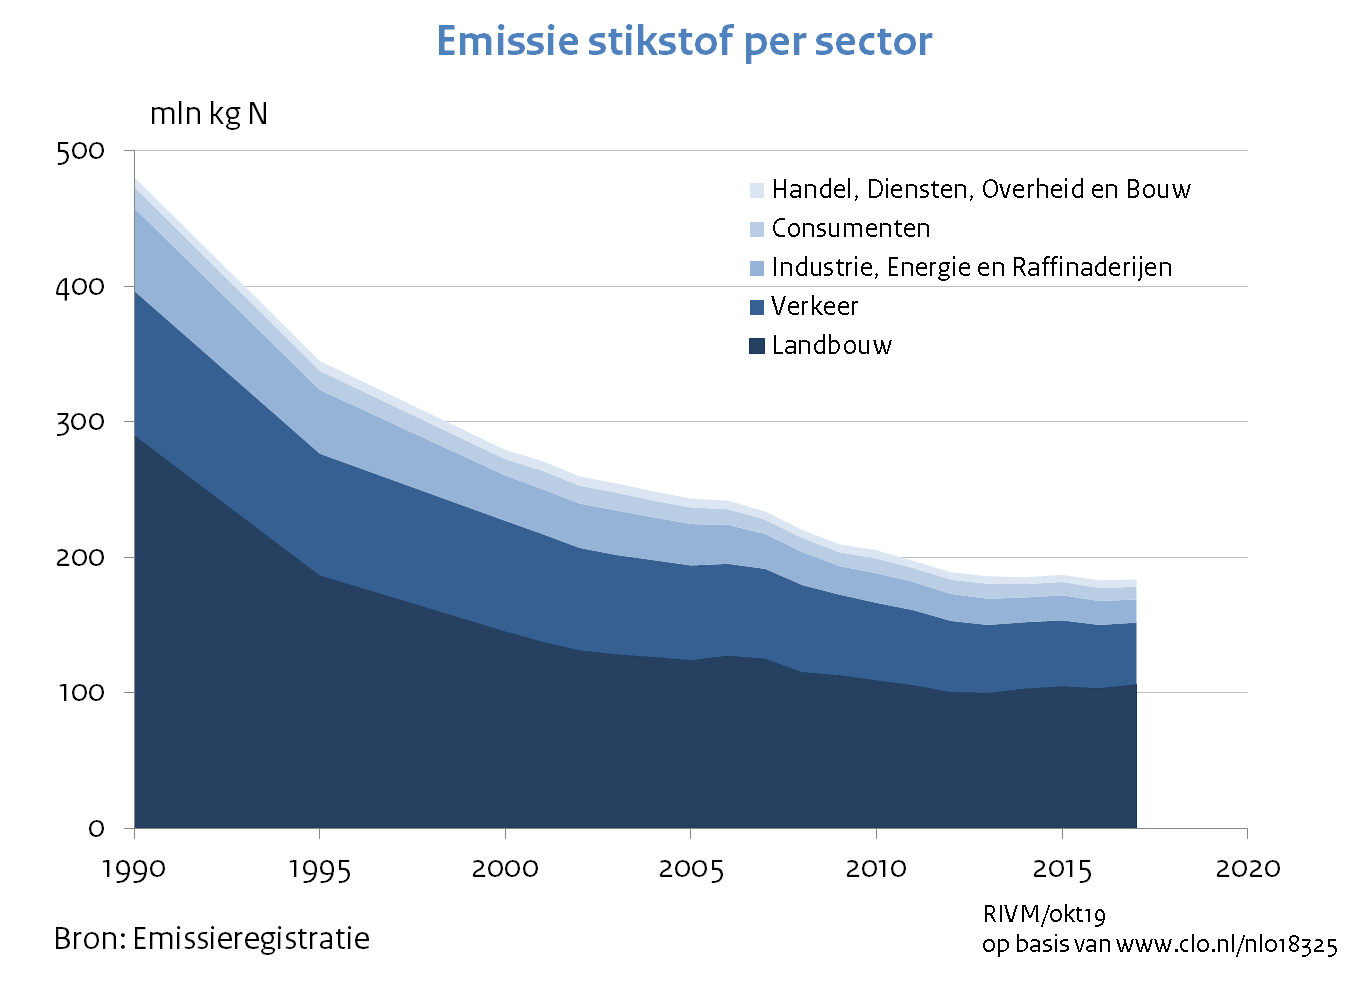
The Dutch institute for the environment shows pretty clearly where emissions are coming from:
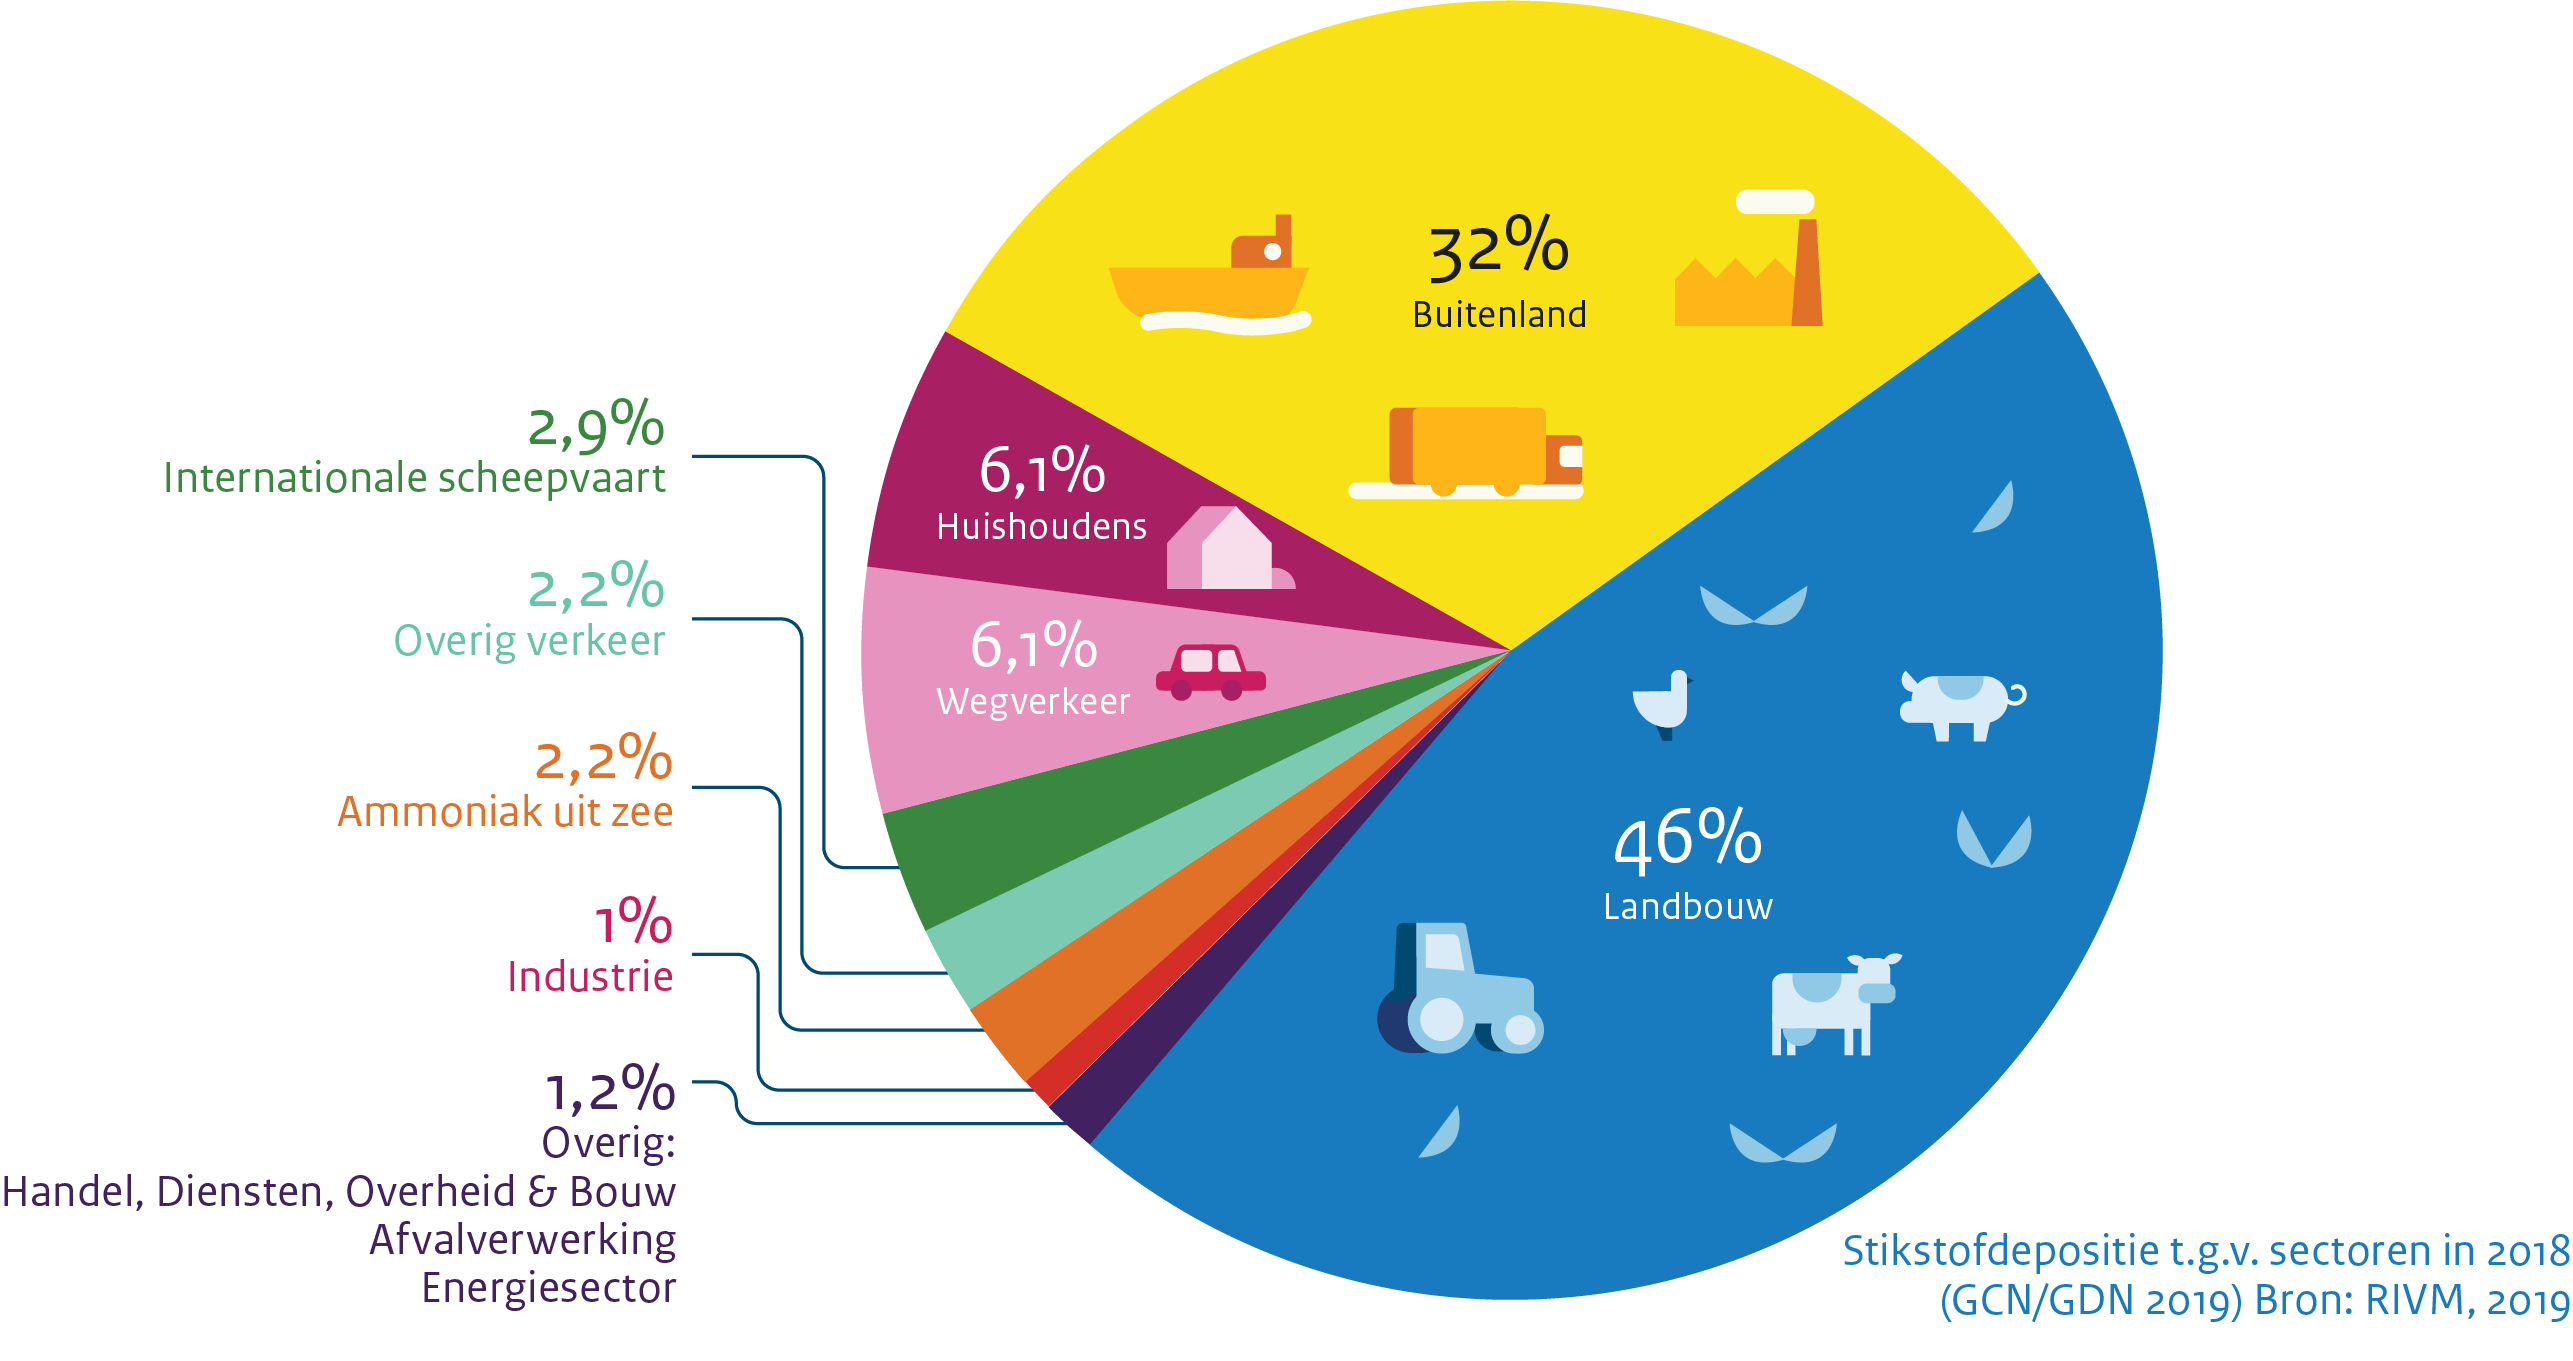
Source: Stikstof / RIVM
As you can see it makes perfect sense to do something about traffic, as it causes 6.1% of emissions. Oh wait, there’s the farming sector: that causes 46% of emissions! Why not tackle that? Well, they tried to at first, but then the farmers did an occupy of the Hague with loads of tractors (twice) and all the politicians chickened out. Because nothing determines policy like a bunch of tractors causing traffic jams. Screw the will of the people anyway.
So… traffic it is then.
Now according the the European Environment Agency in their article Do lower speed limits on motorways reduce fuel consumption and pollutant emissions? , reducing speed limits from 120 to 110 kph will decrease fuel usage by only around 2-3% realistically, BUT will have a pretty large impact on certain pollutants.
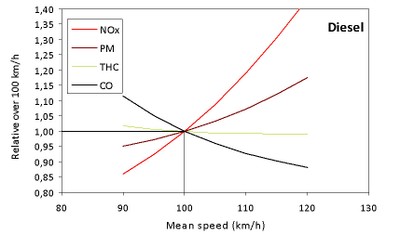
Note: emissions expressed relative to their values at 100 km/h, for which the value ‘1’ is assigned.
Source: EMISIA – ETC/ACM
NOx denotes ‘nitrogen oxides’; PM denotes ‘particulate matter’; THC denotes ‘total hydrocarbons’; CO denotes ‘carbon monoxide’.
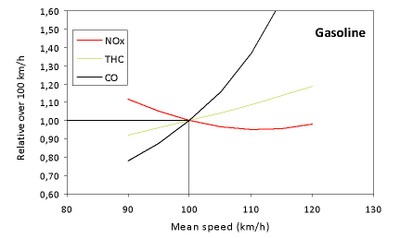
Note: emissions expressed relative to their values at 100 km/h, for which the value ‘1’ is assigned.
Source: EMISIA – ETC/ACM
So reducing speed from 120-100 kph should result (for diesels) in an approx 15% decrease in particulate matter, a 40% decrease in nitrogen oxides but an increase in the amount of total hydrocarbons and carbon monoxides.
For gasoline powered cars the it’s a 20% decrease in total hydrocarbons, which means that in NL, we can knock down the 6.1% of the pie generated by cars to around 4%. Yay. We don’t win much.
Now about traffic flow, because that’s what I’m here for. The Dutch claim that lowering the speed limit will decrease the amount of time spent in traffic jams. Here’s an example of two experts saying so in BNN Vara’s article Experts: Door verlaging maximumsnelheid ben je juist sneller thuis
However, if you look at their conclusion, they come straight out of one of just two studies commonly used by seemingly everyone:
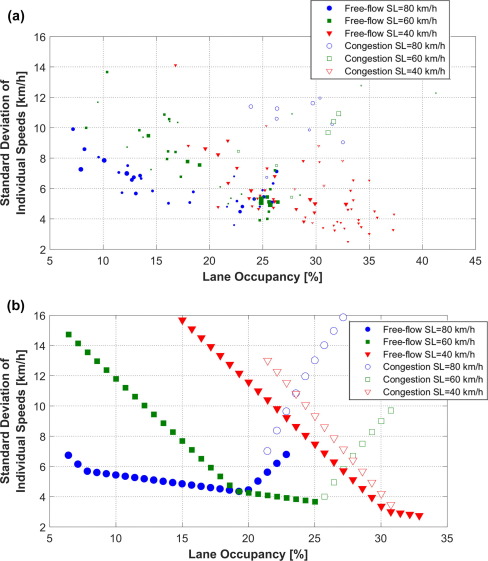
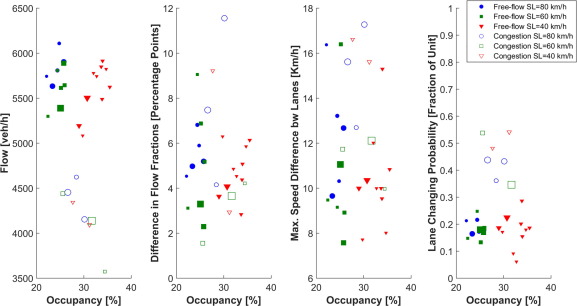
Effects of low speed limits on freeway traffic flow (2017)
It is confirmed that the lower the speed limit, the higher the occupancy to achieve a given flow. This result has been observed even for relatively high flows and low speed limits. For instance, a stable flow of 1942 veh/h/lane has been measured with the 40 km/h speed limit in force. The corresponding occupancy was 33%, doubling the typical occupancy for this flow in the absence of speed limits. This means that VSL strategies aiming to restrict the mainline flow on a freeway by using low speed limits will need to be applied carefully, avoiding conditions as the ones presented here, where speed limits have a reduced ability to limit flows. On the other hand, VSL strategies trying to get the most from the increased vehicle storage capacity of freeways under low speed limits might be rather promising. Additionally, results show that lower speed limits increase the speed differences across lanes for moderate demands. This, in turn, also increases the lane changing rate. This means that VSL strategies aiming to homogenize traffic and reduce lane changing activity might not be successful when adopting such low speed limits. In contrast, lower speed limits widen the range of flows under uniform lane flow distributions, so that, even for moderate to low demands, the under-utilization of any lane is avoided.
There are a few problems with this study: First, it’s talking about speed limits of 40, 60 and 80 kph. Nothing around the 100 – 130kph mark. Secondly, the data in the graphs actually shows a lower occupancy with a higher speed limit – which is not their conclusion!
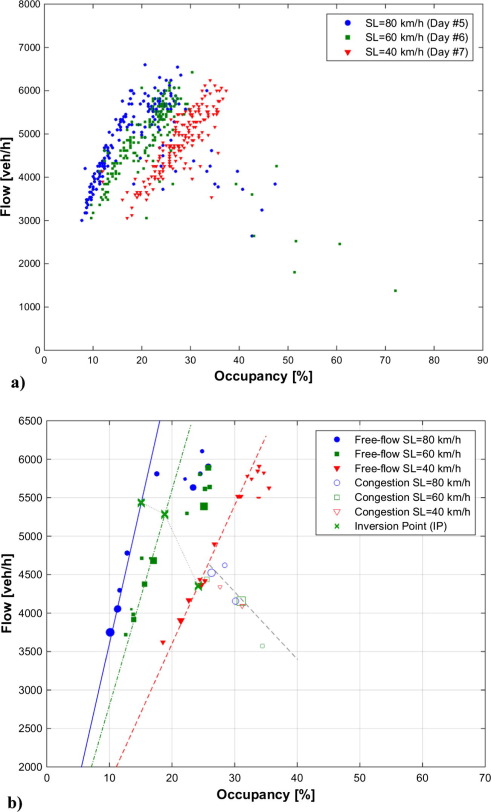
Which is odd, to say the least.
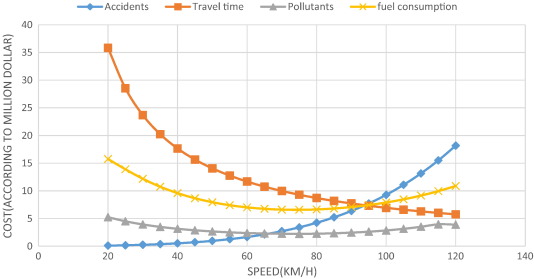
Off to the other study everyone seems to use: Determining optimal speed limits in traffic networks (2014)
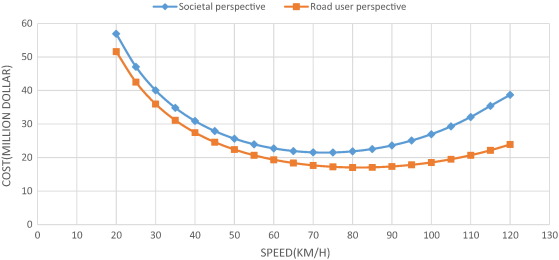
This paper aims to evaluate optimal speed limits in traffic networks in a way that economized societal costs are incurred. In this study, experimental and field data as well as data from simulations are used to determine how speed is related to the emission of pollutants, fuel consumption, travel time, and the number of accidents. This paper also proposes a simple model to calculate the societal costs of travel and relate them to speed. As a case study, using emission test results on cars manufactured domestically and by simulating the suburban traffic flow by Aimsun software, the total societal costs of the Shiraz-Marvdasht motorway, which is one of the most traversed routes in Iran, have been estimated. The results of the study show that from a societal perspective, the optimal speed would be 73 km/h, and from a road user perspective, it would be 82 km/h (in 2011, the average speed of the passing vehicles on that motorway was 82 km/h). The experiments in this paper were run on three different vehicles with different types of fuel. In a comparative study, the results show that the calculated speed limit is lower than the optimal speed limits in Sweden, Norway, and Australia.
(Emphasis mine)
It’s a compelling study with great results, which also include accidents.
In a multi-lane motorway divided by a median barrier in Sweden, the optimal speed is 110 km/h. The speed limit is 110 km/h and the current average speed is 109 km/h. In Norway, the optimal speed from a societal perspective is 100 km/h and the speed limit is 90 km/h. The current average speed is 95 km/h [2]. In Australia, the optimum speeds on rural freeways (dual carriageway roads with grade-separated intersections) would be 110 km/h [3]. Table 3 compares the results in Elvik [2] and Cameron [3] with those of the present study.
Table 3. Optimal speed in Norway, Sweden, Australia, and Iran. Source for columns 2 and 3: Elvik [2]. Source for column 4: Cameron [3].
| Norway | Sweden | Australia | Iran | |
|---|---|---|---|---|
| Optimal speed limits (km/h) according to societal perspective | 100 | 110 | 110 | 73 |
| Optimal speed limits (km/h) according to road user perspective | 110 | 120 | – | 82 |
| Current speed limits (km/h) | 90 | 110 | 110 | 110 |
| Current mean speed of travel (km/h) | 95 | 109 | – | 82 |
There is a significant difference between the results in Iran and those in Sweden, Norway, and Australia; this difference results from the difference in the costs between Iran and these three countries. Also, the functions of fuel consumption and pollutant emission are different.
If you look at the first graph, you can be forgiven for thinking that the optimum speed is 95 kph, as Ruud Horman (from the BNN Vara piece) seems to think. However, as the author of this study is very careful to point out, it’s a very constrained study and there are per country differences – these results are only any good for a very specific highway in a very specific country.
Now there’s a blog post from the National database of traffic data (Nationale Databank Wegverkeersgegevens): De 130 km/u-maatregel gewikt en gewogen: meer of minder fileleed? / The 130 kph weighed: more or fewer traffic jams? (2019)
They come out with a whole load of pretty pictures based on the following graph:

x= intensity, y= speed.

There are quite a lot of graphs like this. So, the speed limit is 120kph (red dots) and the inttesity is 6000 (heavy) then the actual speed is likely to be around 100 kph op the A16. However if the speed limit is 130 kph with the same intensity – oh wait, it doesn’t get to the same intensity. You seem to have higher intensities more often with a speed limit of 120 kph. But if we have an intensity of around 3000 (which I guess is moderate) then you see that quite often the speed is 125 with a speed limit of 130 and around 100 with a speed limit of 120. However, with that intensity you see that there are slightly more datapoints at around 20 – 50 kph if your speed limit is 130kph than if it’s 120kph.
Oddly enough, they never added data from 100kph, of which there were (and are) plenty of roads. They also never take into account variable speed limits. The 120kph limit is based on data taken in 2012 and the 130kph limit is based on data from 2018.
Their conclusion – raising the speed limit wins you time when the roads are quiet and puts you into a traffic jam when the roads are busy – is spurious and lacks the data to be able to support it.
Now we come to more recent research from China: The Effect of Posted Speed Limit on the Dispersion of Traffic Flow Speed (PDF here)
The conclusion is pretty tough reading but the graphs are quite clear
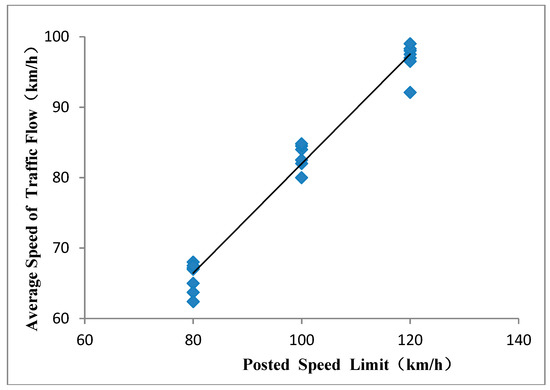
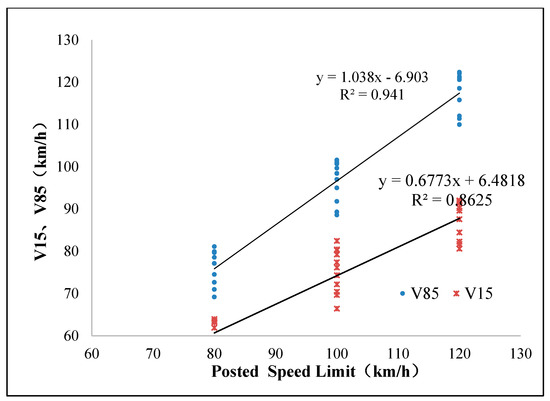
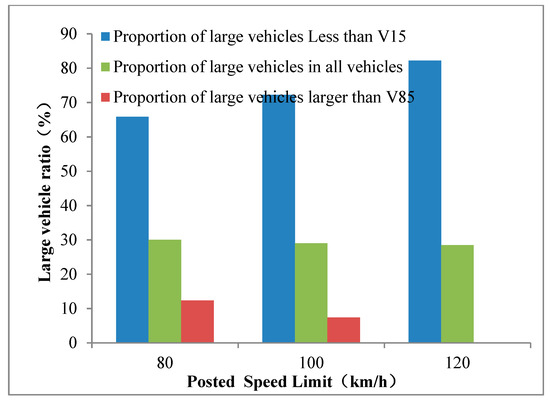
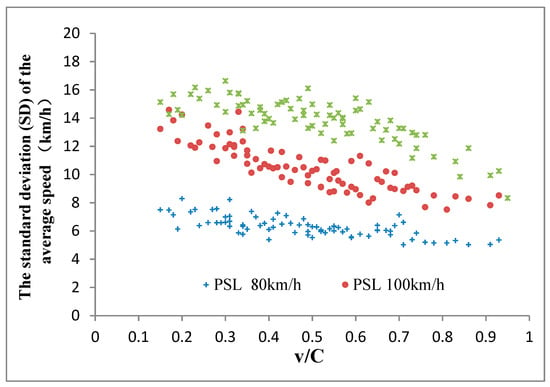
What they are basically saying is: we researched it pretty well and we had a look at the distribution of vehicle types. Basically, if you set a higher speed limit, people will drive faster. There is variability (the bars you see up and down the lines) so sometimes they will drive faster and somethims they will drive slower but they generally go faster on average with a higher speed limit.
Now one more argument is that the average commute is only about an hour per day. So if you go slower, you will only save a few minutes. The difference between 100 and 130kph is a 30% difference. Over an hour period (say 100 km), that’s a 21 minute difference, assuming you can travel that distance at that speed (what they call free flow conditions). Sure you’ll never get that, but over large distances you can come close. Anyway, say we halve that and say it’s a 10 minute difference. The argument becomes that this is just barely a cup of tea. But it’s 10 minutes difference EVERY WORKING DAY! Excluding weekends and holidays, you can expect to make that commute around 250 times per year, making your net loss 2500 minutes (at least), which is 41 hours or a full working week you now have to spend extra in the car!
Considering the low net environmental gains and the falsity of the arguments saying you will spend less time in traffic jams as the speed decreases – and don’t get me started on traffic accidents, because they go up and down like a yoyo despite speed limit differences
– reducing the speed limit seems like poor populist policy to appease the farmers, look like Something is Being Done ™ and not actually get anything real to happen except piss off commuters.

Robin Edgar
Organisational Structures | Technology and Science | Military, IT and Lifestyle consultancy | Social, Broadcast & Cross Media | Flying aircraft