
Microsoft just open sourced their data exploration tool known as SandDance:
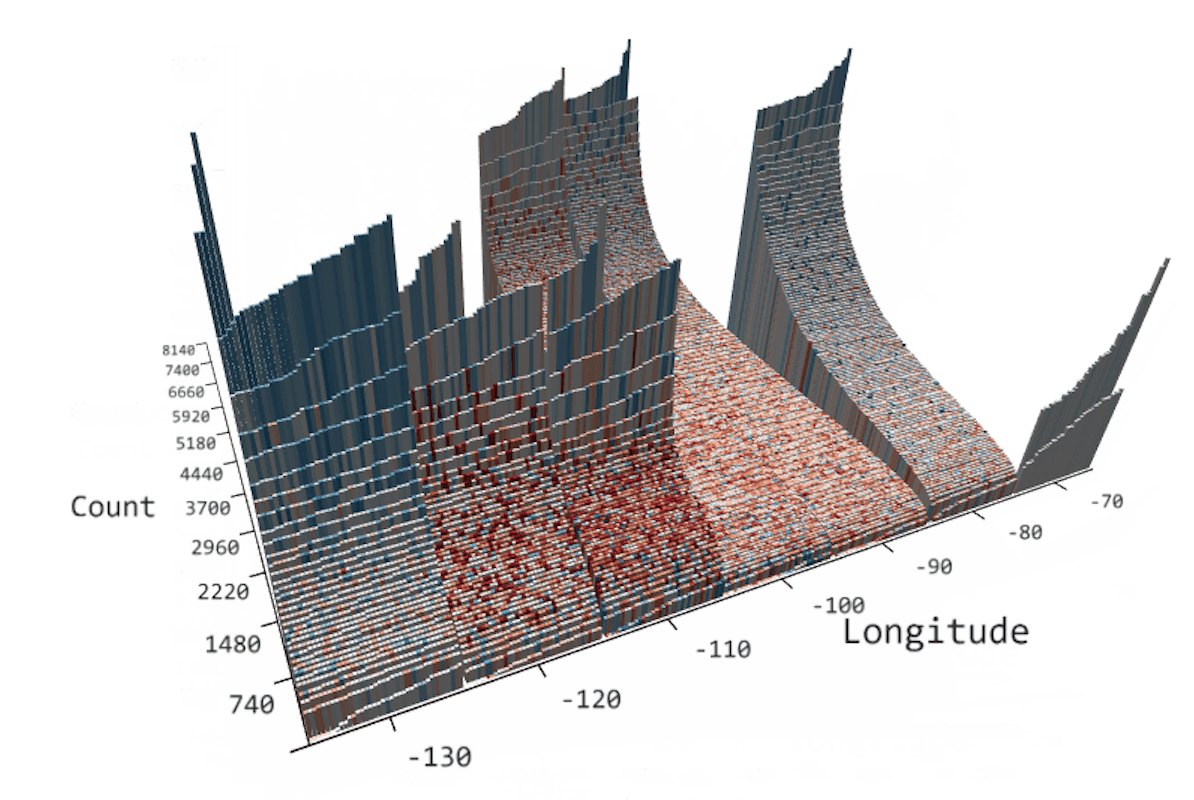
For those unfamiliar with SandDance, it was introduced nearly four years ago as a system for exploring and presenting data using “unit visualizations.” Instead of aggregating data and showing the resulting sums as bar charts, SandDance shows every single row of a dataset (for datasets up to ~500K rows). It represents each of these rows as a mark that can be colored and organized into different areas on the screen. Thus, bar charts are made of their constituent units, stacked, or sorted.
Nice. I hadn’t heard about SandDance until now, but I’m saving for later. You can grab the source on GitHub.
Source: Microsoft’s visual data explorer SandDance open sourced | FlowingData

Robin Edgar
Organisational Structures | Technology and Science | Military, IT and Lifestyle consultancy | Social, Broadcast & Cross Media | Flying aircraft