This tool allows you to search Flickr and download the images all in one go when you are ready.

These pages have a few benchmark tests for PHP4 perfomance to do the same thing using different methods.:
NB Refresh the pages a few times, the results change as webserver load differs.
NB. check out the ring on the guys hand in the first few frames 🙂
There are a few ways to visualise internet and the traffic on it.
One way is to map it. The BBC has a good article on this.
The following programmes take a starting point and use linking for distance. The amount of links to and from a place is used for size.

Here is a large list of links to mapping projects
The above can lead to complex maps, usually starting from a single point (a URL).
More simply, smaller datasets can be mapped.
3D Traceroute turns a traceroute into a complex grapical representation.

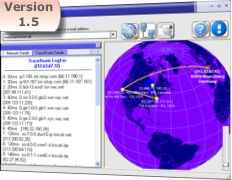
Xtraceroute shows a 3D globe and shows the path of the packets over the globe.

Another method is to browse traffic and see what it’s doing.
Swarm shows what other swarmers are doing, with the page with the most traffic in the centre.


Webcollage randomly pulls images from internet and throws them up on the screen.
Then there are more freeform methods of viewing the internet.

This site has a large list of programmes to manage your windows processes, memory, cpu etc etc etc.
This is the list of programmes I thought might be usefull:
Sysinternals Process Explorer shows you information about which handles and DLLs processes have opened or loaded
Statbar shows a skinneable bar across the top of the screen with processor information etc. in it.
Yup, become a virtual machine for free!
Download
and
VMWare product comparison here
Don’t forget to pack a few extra Gigs of RAM!
Google has a calculator built into its search engine. Apart from the basics it can also be used for unit conversions, etc. Usually I’d say that’s very nice and can be handy considering just about everything has a google query form attached to it these days.
However..
What do you think would be the result of
1 - 0.9 - 0.1
?
Depending on the order of evaluation you’d say either 0 or 0.2, right? Well, you’re wrong. It’s -2.77555756 × 10e17. Because Google says so. Try it.
http://www.google.nl/search?q=1+-+0.9+-+0.1
It gets the answer to 1 – (0.9 + 0.1) right, but anything else is off.
1 - (0.9) - (0.1)
(1 - 0.9) - 0.1
etc.
A mountain full of PhDs and what do you get? A variation on pi = 3.
With Opera being free, the triumphant march of Firefox, IE bending its back to get better, does anyone smell browser wars again?

