
There are a few ways to visualise internet and the traffic on it.
One way is to map it. The BBC has a good article on this.
The following programmes take a starting point and use linking for distance. The amount of links to and from a place is used for size.

Here is a large list of links to mapping projects
The above can lead to complex maps, usually starting from a single point (a URL).
More simply, smaller datasets can be mapped.
3D Traceroute turns a traceroute into a complex grapical representation.

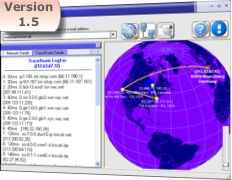
Xtraceroute shows a 3D globe and shows the path of the packets over the globe.

Another method is to browse traffic and see what it’s doing.
Swarm shows what other swarmers are doing, with the page with the most traffic in the centre.

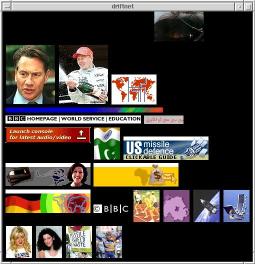
Webcollage randomly pulls images from internet and throws them up on the screen.
Then there are more freeform methods of viewing the internet.
Robin