
There are loads of ways of visualising the universe – through radiation, dark matter, gravitational fields, distribution of visible light etc. And then there are the times as which the universe is visualised – at the beginning, as it grows, now and projected into the future. String theory makes for even more different ways of looking at it as multiple concurrent universes can be visualised and there are loads of thing you can (thoeretically) do with the fabric of space to visualise it differently yet again. The images obtained are very compelling and diverse indeed.
NASAs WMAP program uses microwave images

and has made a time line of the universe and it’s expansion
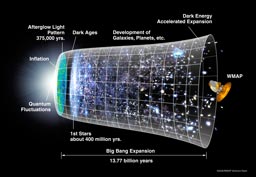
They have many more images on their site.
The Sloan Digital Sky Survey
Simply put, the Sloan Digital Sky Survey (SDSS) is the most ambitious astronomical survey ever undertaken. When completed, it will provide detailed optical images covering more than a quarter of the sky, and a 3-dimensional map of about a million galaxies and quasars. As the survey progresses, the data are released to the scientific community and the general public in annual increments.
They have a lot of datapoints on their sites and quite a few images.
But Spaceref had the only picture I could find with everything they’d mapped on it in one go.


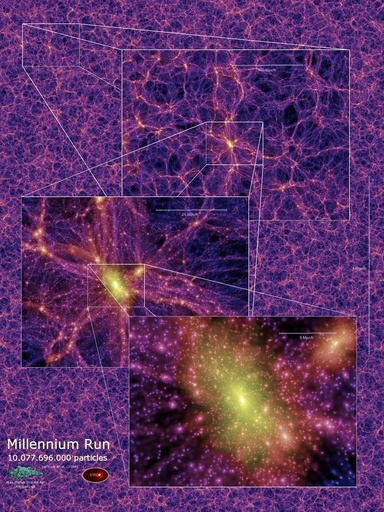
More of their images are to be found here
Robin