In recent weeks, China’s space program has made news by revealing some of its long-term ambitions for spaceflight. These include establishing an Earth-Moon space economic zone by 2050, which, if successful, could allow the country to begin to dictate the rules of behavior for future space exploration.
Some have questioned whether China, which has flown six human spaceflights in the last 16 years, can really build a large low-Earth space station, send taikonauts to the Moon, return samples from Mars, and more in the coming decade or two. But what seems clear is that the country’s authoritarian government has long-term plans and is taking steps toward becoming a global leader in space exploration.
By one important metric—orbital launches—China has already reached this goal.
In 2018, the country set a goal of 35 orbital launches and ended up with 39 launch attempts. That year, the United States (29 flights) and Russia (20) trailed China, according to Space Launch Report. It marked the first time China led the world in the number of successful orbital launches.
This year, China is set to pace the world again. Through Sunday, the country has launched 27 orbital missions, followed by Russia (19), and the United States (16). Although nearly a month and a half remain in this year, a maximum of six additional orbital launches are likely from the United States in 2019.
The US office responsible for patents and trademarks is trying to figure out how AI might call for changes to copyright law, and it’s asking the public for opinions on the topic. The United States Patent and Trademark Office (USPTO) published a notice in the Federal Register last month saying it’s seeking comments, as spotted by TorrentFreak.
The office is gathering information about the impact of artificial intelligence on copyright, trademark, and other intellectual property rights. It outlines thirteen specific questions, ranging from what happens if an AI creates a copyright-infringing work to if it’s legal to feed an AI copyrighted material.
It starts off by asking if output made by AI without any creative involvement from a human should qualify as a work of authorship that’s protectable by US copyright law. If not, then what degree of human involvement “would or should be sufficient so that the work qualifies for copyright protection?”
Other questions ask if the company that trains an AI should own the resulting work, and if it’s okay to use copyrighted material to train an AI in the first place. “Should authors be recognized for this type of use of their works?” asks the office. “If so, how?”
The office, which, among other things, advises the government on copyright, often seeks public opinion to understand new developments and hear from people who actually deal with them. Earlier this year, the office similarly asked for public opinion on AI and patents.
researchers recorded the brain activity of mice staring at images and used the data to help make computer vision models more robust against adversarial attacks.
Convolutional neural networks (CNNs) used for object recognition in images are all susceptible to adversarial examples. These inputs have been tweaked in some way, whether its adding random noise or changing a few pixels here or there, that forces a model to incorrectly recognize an object. Adversarial attacks cause these systems to mistake an image of a banana for a toaster, or a toy turtle for a rifle.
[…]
, a group of researchers led by Baylor College of Medicine, Texas, have turned to mice for inspiration, according to a paper released on arXiv.
“We presented natural images to mice and measured the responses of thousands of neurons from cortical visual areas,” they wrote.
“Next, we denoised the notoriously variable neural activity using strong predictive models trained on this large corpus of responses from the mouse visual system, and calculated the representational similarity for millions of pairs of images from the model’s predictions.”
As you can tell the paper is pretty jargony. In simple terms, the researchers recorded the brain activity of the mice staring at thousands of images and used that data to build a similar computational system that models that activity. To make sure the mice were looking at the image, they were “head-fixed” and put on a treadmill.
[…]
When the CNN was tasked with classifying a different set of images that were not presented to the mice, its accuracy was comparable to a ResNet-18 model that had not been regularized. But as the researchers began adding random noise to those images, the performance of the unregularized models dropped more drastically compared to the regularized version.
“We observed that the CNN model becomes more robust to random noise when neural regularization is used,” the paper said. In other words, the mice-hardened ResNet-18 model is less likely to be fooled by adversarial examples if it contains features that have been borrowed by real biological mouse brains.
The researchers believe that incorporating these “brain-like representations” into machine learning models could help them reach “human-like performance” one day. But although the results seem promising, the researchers have no idea how it really works.
“While our results indeed show the benefit of adopting more brain-like representation in visual processing, it is however unclear which aspects of neural representation make it work. We think that it is the most important question and we need to understand the principle behind it,” they concluded
An experimental feature silently rolled out to the stable Chrome release on Tuesday caused chaos for IT admins this week after users complained of facing white, featureless tabs on Google’s massively popular browser.
The issue affected thousands of businesses’ terminal servers, with multiple users on the same server experiencing “white screen of death” at the same time.
We have confirmed and replicated; when any user on a shared session citrix box locks their screen, all Chrome windows stop rendering (“White screen of death”) until ANYONE unlocks their screen, upon which, all Chrome windows resume rendering. This looks like random behaviour to the user but we have confirmed lock/unlock is the culprit.
The person added: “We have fixed this temporarily by starting chrome with –disable-backgrounding-occluded-windows,” applying the fix through a group policy object.
Google software engineer David Bienvenu jumped in to explain:
The experiment/flag has been on in beta for ~5 months. It was turned on for stable (e.g., m77, m78) via an experiment that was pushed to released Chrome Tuesday morning.
At 1824 UTC last night, Bienvenu rolled back the experiment change, noting “I’m not sure how long it takes to go live, but once it’s live, users will need to restart Chrome to get the change.”
A new German law passed yesterday requires Apple to allow other mobile payments services access to the iPhone’s NFC chip for payments to allow them to fully compete with Apple Pay.
Apple initially completely locked down the NFC chip so that it could be used only by Apple Pay. It later allowed some third-party apps to use the chip but has always refused to do so for other mobile payment apps
Banks have been demanding access to the NFC chip for their own payment apps since 2016. Australia’s three biggest banks claimed that locking them out of the NFC chip was anti-competitive behavior.
National Australia Bank, Commonwealth Bank of Australia and Westpac Banking Corp all want the right to access the NFC chip in iPhones for their own mobile wallet apps.
Reuters reports that the law doesn’t name Apple specifically, but would apply to the tech giant. The piece somewhat confusingly refers to access to the NFC chip by third-party payment apps as Apple Pay.
A German parliamentary committee unexpectedly voted in a late-night session on Wednesday to force the tech giant to open up Apple Pay to rival providers in Germany.
This came in the form of an amendment to an anti-money laundering law that was adopted late on Thursday by the full parliament and is set to come into effect early next year.
The legislation, which did not name Apple specifically, will force operators of electronic money infrastructure to offer access to rivals for a reasonable fee.
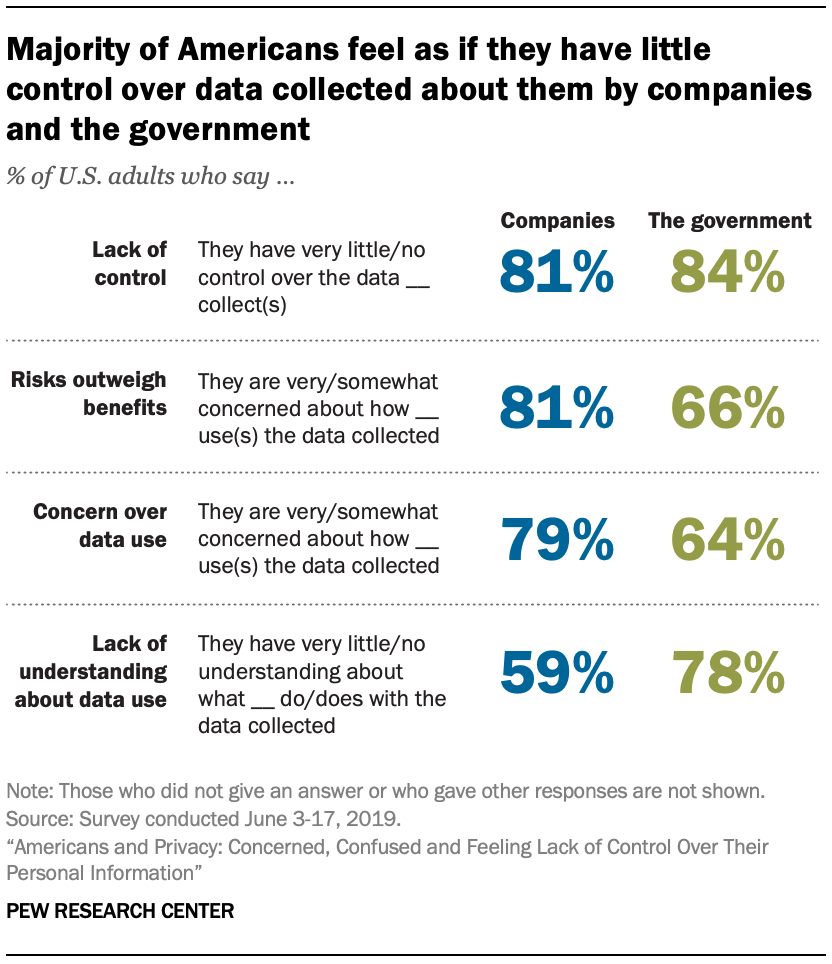
A majority of Americans believe their online and offline activities are being tracked and monitored by companies and the government with some regularity. It is such a common condition of modern life that roughly six-in-ten U.S. adults say they do not think it is possible to go through daily life without having data collected about them by companies or the government.
[…]
large shares of U.S. adults are not convinced they benefit from this system of widespread data gathering. Some 81% of the public say that the potential risks they face because of data collection by companies outweigh the benefits, and 66% say the same about government data collection. At the same time, a majority of Americans report being concerned about the way their data is being used by companies (79%) or the government (64%). Most also feel they have little or no control over how these entities use their personal information,
[…]
Fully 97% of Americans say they are ever asked to approve privacy policies, yet only about one-in-five adults overall say they always (9%) or often (13%) read a company’s privacy policy before agreeing to it. Some 38% of all adults maintain they sometimes read such policies, but 36% say they never read a company’s privacy policy before agreeing to it.
[…]
Among adults who say they ever read privacy policies before agreeing to their terms and conditions, only a minority – 22% – say they read them all the way through before agreeing to their terms and conditions.
There is also a general lack of understanding about data privacy laws among the general public: 63% of Americans say they understand very little or nothing at all about the laws and regulations that are currently in place to protect their data privacy.
Indian officials acknowledged on October 30th that a cyberattack occurred at the country’s Kudankulam nuclear power plant. An Indian private cybersecurity researcher had tweeted about the breach three days earlier, prompting Indian authorities to initially deny that it had occurred before admitting that the intrusion had been discovered in early September and that efforts were underway to respond to it.
According to last Monday’s Washington Post, Kudankulam is India’s biggest nuclear power plant, “equipped with two Russian-designed and supplied VVER pressurized water reactors with a capacity of 1,000 megawatts each. Both reactor units feed India’s southern power grid. The plant is adding four more reactor units of the same capacity, making the Kudankulam Nuclear Power Plant one of the largest collaborations between India and Russia.”
While reactor operations at Kudankulam were reportedly unaffected, this incident should serve as yet another wake-up call that the nuclear power industry needs to take cybersecurity more seriously. There are worrying indications that it currently does not: A 2015 report by the British think tank Chatham House found pervasive shortcomings in the nuclear power industry’s approach to cybersecurity, from regulation to training to user behavior. In general, nuclear power plant operators have failed to broaden their cultures of safety and security to include an awareness of cyberthreats. (And by cultures of safety and security, those in the field—such as the Fissile Materials Working Group—refer to a broad, all-embracing approach towards nuclear security, that takes into account the human factor and encompasses programs on personnel reliability and training, illicit trafficking interception, customs and border security, export control, and IT security, to name just a few items. The Hague Communiqué of 2014 listed nuclear security culture as the first of its three pillars of nuclear security, the other two being physical protection and materials accounting.)
This laxness might be understandable if last week’s incident were the first of its kind. Instead, there have been over 20 known cyber incidents at nuclear facilities since 1990.
Algorithms identified death notices in old newspaper pages, then another set of algorithms pulled names and other key details into a searchable database. From a report: Ancestry used artificial intelligence to extract obituary details hidden in a half-billion digitized newspaper pages dating back to 1690, data invaluable for customers building their family trees. The family history and consumer-genomics company, based in Lehi, Utah, began the project in late 2017 and introduced the new functionality last month. Through its subsidiary Newspapers.com, the company had a trove of newspaper pages, including obituaries — but it said that manually finding and importing those death notices to Ancestry.com in a form that was usable for customers would likely have taken years. Instead, Ancestry tasked its 24-person data-science team with having technology pinpoint and make sense of the data. The team trained machine-learning algorithms to recognize obituary content in those 525 million newspaper pages. It then trained another set of algorithms to detect and index key facts from the obituaries, such as names of the deceased’s spouse and children, birth dates, birthplaces and more.
Ancestry, which has about 3.5 million subscribers, now offers about 262 million obituaries, up from roughly 40 million two years ago. Its database includes about a billion names associated with obituaries, including names of the deceased and their relatives. Besides analyzing the trove of old newspaper pages, the algorithms were also applied to online obituaries coming into Ancestry’s database, making them more searchable. Before the AI overhaul, the roughly 40 million obituaries on Ancestry.com were searchable only by the name of the deceased. That meant a search for “Mary R. Smith,” for instance, would yield obituaries only for people with that name — not other obituaries that mentioned that name as a sibling or child.
Hackers didn’t waste any time and have started hijacking Disney+ user accounts hours after the service launched.
Many of these accounts are now being offered for free on hacking forums, or available for sale for prices varying from $3 to $11, a ZDNet investigation has discovered.
A stream of user complaints
The Disney+ video streaming service launched this week, on November 12. The service, although being available only in the US, Canada, and the Netherlands, has already amassed more than 10 million customers in its first 24 hours.
The Disney+ launch was marred by technical issues. Many users reported being unable to stream their favorite movies and shows.
But hidden in the flood of complaints about technical issues was a smaller stream of users reporting losing access to their accounts.
Many users reported that hackers were accessing their accounts, logging them out of all devices, and then changing the account’s email and password, effectively taking over the account and locking the previous owner out.
Aside from traditional cable, which remains a must for any sports fan at the absolute least, there now exist more than a half-dozen prominent streaming services (and lots more small ones), all filled with a couple of buzzy shows, some old favorites, and endless filler crap that makes the library of content seem more valuable than it is. And if keeping up with the Emmy-nominated offerings of services like Netflix, Hulu, and Amazon Prime didn’t already feel like a financial strain, the launch of Apple TV+ and the fawned-over premiere of Disney+ might have done it.
By my count, if you want to watch shows on HBO, Apple TV+, Disney+, CBS All-Access, Amazon Prime, Hulu, and Netflix, it’d run you $60.93 a month or $731.16 a year, and that’s before factoring in a standard cable package for live events and other shows, or the other streaming services sure to launch in the near future. (NBC’s got one coming down the pike.)
[…]
Instead of letting viewers just pay for the stuff they watch, they’re forced, instead, to choose between equally flawed packages where the fun and/or high-quality shows get bundled with pointless crap that jacks up the price. Unlike Spotify and its clones, which include essentially all the music a person could want, one relatively cheap subscription to any Movie/TV streaming service doesn’t give you access to more-or-less the entire history of moving pictures. And unlike Spotify and its clones, which have caused a massive downturn in music piracy, the shows on all these platforms are ripe for stealing.
[…]
A simple glance at torrent websites shows that plenty of people are stealing from the brand new steaming services—episodes of The Mandalorian and Dickinson all have hundreds or thousands of seeders and are among the most popular shows on torrent sites. I reached out specifically to Disney, Apple, and Netflix to ask what their policy was on going after pirated content, and haven’t heard back, but it’s obvious that these companies assume that at least some of their viewers aren’t paying the full price for their services. Given that you can watch as many as six simultaneous streams with Apple TV+, and four with Disney+ and the top Netflix package, the more common form of piracy—password sharing—is built into the system.
Trusted Platform Module (TPM) serves as a root of trust for the operating system. TPM is supposed to protect our security keys from malicious adversaries like malware and rootkits.
Most laptop and desktop computers nowadays come with a dedicated TPM chip, or they use the Intel firmware-based TPM (fTPM) which runs on a separate microprocessor inside the CPU. Intel CPUs support fTPM since the Haswell generation (2013). TPM chips are also used in other computing devices such as cellphones and embedded devices.
We discovered timing leakage on Intel firmware-based TPM (fTPM) as well as in STMicroelectronics’ TPM chip. Both exhibit secret-dependent execution times during cryptographic signature generation. While the key should remain safely inside the TPM hardware, we show how this information allows an attacker to recover 256-bit private keys from digital signature schemes based on elliptic curves.
[…]
here is a high chance that you are affected. This depends if any of your computing devices (laptop, tablet, desktop, etc.) use Intel fTPM or STMicroelectronics TPM chips.
Late Wednesday night, Pornhub announced that PayPal is no longer supporting payments for Pornhub—a decision that will impact thousands of performers using the site as a source of income.
Most visitors to Pornhub likely think of it as a website that simply provides access to an endless supply of free porn, but Pornhub also allows performers to upload, sell, and otherwise monetize videos they make themselves. Performers who used PayPal to get paid for this work now have to switch to a different payment method.
“We are all devastated by PayPal’s decision to stop payouts to over a hundred thousand performers who rely on them for their livelihoods,” the company said on its blog. It then directed models to set up a new payment method, with instructions on how PayPal users can transfer pending payments.
“We sincerely apologize if this causes any delays and we will have staff working around the clock to make sure all payouts are processed as fast as possible on the new payment methods,” the statement said.
A PayPal spokesperson told Motherboard: “Following a review, we have discovered that Pornhub has made certain business payments through PayPal without seeking our permission. We have taken action to stop these transactions from occurring.”
PayPal is one of many payment processors that have discriminated against sex workers for years. Its acceptable use policy states that “certain sexually oriented materials or services” are forbidden—phrasing that’s intentionally vague enough to allow circumstances like this to happen whenever the company wants.
Are you a sex worker who has been impacted by this situation, or by any payment processors discriminating against your work? We’d love to hear from you. Contact Samantha Cole securely on Signal at +6469261726, direct message on Twitter, or by email.
The list of payment platforms, payment apps, and banks that forbid sexual services in their terms of use is very, very long, and includes everything from Venmo to Visa. Many of these terms have been in place for nearly a decade—and payment processors have been hostile toward sex work long before harmful legislation like the Fight Online Sex Trafficking Act came into law last year. But those laws only help to embolden companies to kick sex workers off their platforms, and make the situation even more confusing and frustrating for performers.
Researchers in Sussex have built a device that displays 3D animated objects that can talk and interact with onlookers.
A demonstration of the display showed a butterfly flapping its wings, a countdown spelled out by numbers hanging in the air, and a rotating, multicoloured planet Earth. Beyond interactive digital signs and animations, scientists want to use it to visualise and even feel data.
[…]
it uses a 3D field of ultrasound waves to levitate a polystyrene bead and whip it around at high speed to trace shapes in the air.
The 2mm-wide bead moves so fast, at speeds approaching 20mph, that it traces out the shape of an object in less than one-tenth of a second. At such a speed, the brain doesn’t see the moving bead, only the completed shape it creates. The colours are added by LEDs built into the display that shine light on the bead as it zips around.
Because the images are created in 3D space, they can be viewed from any angle. And by careful control of the ultrasonic field, the scientists can make objects speak, or add sound effects and musical accompaniments to the animated images. Further manipulation of the sound field enables users to interact with the objects and even feel them in their hands.
[…]
The images are created between two horizontal plates that are studded with small ultrasonic transducers. These create an inaudible 3D sound field that contains a tiny pocket of low pressure air that traps the polystyrene bead. Move the pocket around, by tweaking the output of the transducers, and the bead moves with it.
The most basic version of the display creates 3D colour animations, but writing in the journal Nature, the scientists describe how they improved the display to produce sounds and tactile responses to people reaching out to the image.
Speech and other sounds, such as a musical accompaniment, were added by vibrating the polystyrene bead as it hares around. The vibrations can be tuned to produce soundwaves across the entire range of human hearing, creating, for example, crisp and clear speech. Another trick makes the display tactile by manipulating the ultrasonic field to create a virtual “button” in mid-air.
The prototype uses a single bead and can create images inside a 10cm-wide cube of air. But future displays could use more powerful transducers to make larger animations, and employ multiple beads at once. Subramanian said existing computer software can be used to ensure the tiny beads do not crash into one another, although choreographing the illumination of multiple beads mid-air is another problem.
[…]
“The interesting thing about the tactile content is that it’s created using ultrasound waves. Unlike the simple vibrations most people are familiar with through smartphones or games consoles, the ultrasound waves move through the air to create precise patterns against your hands. This allows multimedia experiences where the objects you feel are just as rich and dynamic as the objects you see in the display.”
Julie Williamson, also at Glasgow, said levitating displays are a first step towards truly interactive 3D displays. “I imagine a future where 3D displays can create experiences that are indistinguishable from the physical objects they are simulating,” she said.
The fossil fuels driving climate change make people sick, and so do impacts like extreme heat, wildfires, and more extreme storms, according to research published on Wednesday. In short, the climate crisis is a public health crisis.
A new report from premiere medical journal the Lancet tallies the medical toll of climate change and finds last year saw record-setting numbers of people exposed to heat waves and a near-record spread of dengue fever globally. The scientists also crunched numbers around wildfires for the first time, finding that 77 percent of countries are facing more wildfire-induced suffering than they were at the start of the decade. But while some of the report’s findings are rage-inducing, it also shows that improving access to healthcare may be among the most beneficial ways we can adapt to climate change.
[…]
Heat waves are among the more obvious climate change-linked weather disasters, and the report outlines just how much they’re already hurting the world. Last year saw intense heat waves go off around the world from the UK to Pakistan, to Japan amid the fourth warmest year on record.
[…]
The report also found that 2018 marked the second-worst year since accurate record keeping began in 1990 for the spread of dengue fever-carrying mosquitoes. The two types of mosquitoes that transmit dengue have seen their range expand as temperatures have warmed
[…]
wildfire findings, which are new to this year’s report. Scientists found that more than three-quarters of countries around the world are seeing increased prevalence of wildfires and the sickness-inducing smoke that accompanies them.
[…]
there are also the health risks that come from burning fossil fuels themselves. Air pollution has ended up in people’s lungs where it can cause asthma and other respiratory issues, but it’s also showed up in less obvious locations like people’s brains and women’s placentas.
[…]
“We can do better than to dwell on the problem,” Gina McCarthy, the former head of the Environmental Protection Agency and current Harvard public health professor, said on the press call.
The report found, for example, that despite an uptick in heat waves and heavy downpours that can spur diarrheal diseases, outbreaks have become less common. Ditto for protein-related malnutrition despite the impact intense heat is having on the nutritional value of staple crops and ocean heat waves on coral reefs and fisheries that rely on them. At least some of that is attributable to improved access to healthcare, socioeconomic opportunities, and sanitation in some regions.
We often think about sea walls or other hard infrastructure when it comes to climate adaptation. But rural health clinics and sewer systems fall into that same category, as do programs like affordable crop insurance. The report suggests improving access to financing health-focused climate projects could pay huge dividends as a result, ensuring that people are insulated from the impacts of climate change and helping lift them out of poverty in the process. Of course it also calls for cutting carbon pollution ASAP because even the best equipped hospital in the world isn’t going to be enough to protect people from the full impacts of climate change.
Google will soon offer checking accounts to consumers, becoming the latest Silicon Valley heavyweight to push into finance. The Wall Street Journal: The project, code-named Cache, is expected to launch next year with accounts run by Citigroup and a credit union at Stanford University, a tiny lender in Google’s backyard. Big tech companies see financial services as a way to get closer to users and glean valuable data. Apple introduced a credit card this summer. Amazon.com has talked to banks about offering checking accounts. Facebook is working on a digital currency it hopes will upend global payments. Their ambitions could challenge incumbent financial-services firms, which fear losing their primacy and customers. They are also likely to stoke a reaction in Washington, where regulators are already investigating whether large technology companies have too much clout.
The tie-ups between banking and technology have sometimes been fraught. Apple irked its credit-card partner, Goldman Sachs Group, by running ads that said the card was “designed by Apple, not a bank.” Major financial companies dropped out of Facebook’s crypto project after a regulatory backlash. Google’s approach seems designed to make allies, rather than enemies, in both camps. The financial institutions’ brands, not Google’s, will be front-and-center on the accounts, an executive told The Wall Street Journal. And Google will leave the financial plumbing and compliance to the banks — activities it couldn’t do without a license anyway.
Popular health websites are sharing private, personal medical data with big tech companies, according to an investigation by the Financial Times. The data, including medical diagnoses, symptoms, prescriptions, and menstrual and fertility information, are being sold to companies like Google, Amazon, Facebook, and Oracle and smaller data brokers and advertising technology firms, like Scorecard and OpenX.
The investigation: The FT analyzed 100 health websites, including WebMD, Healthline, health insurance group Bupa, and parenting site Babycentre, and found that 79% of them dropped cookies on visitors, allowing them to be tracked by third-party companies around the internet. This was done without consent, making the practice illegal under European Union regulations. By far the most common destination for the data was Google’s advertising arm DoubleClick, which showed up in 78% of the sites the FT tested.
Responses: The FT piece contains a list of all the comments from the many companies involved. Google, for example, said that it has “strict policies preventing advertisers from using such data to target ads.” Facebook said it was conducting an investigation and would “take action” against websites “in violation of our terms.” And Amazon said: “We do not use the information from publisher websites to inform advertising audience segments.”
A window into a broken industry: This sort of rampant rule -breaking has been a dirty secret in the advertising technology industry, which is worth $200 billion globally, ever since EU countries adopted the General Data Protection Regulation in May 2018. A recent inquiry by the UK’s data regulator found that the sector is rife with illegal practices, as in this case where privacy policies did not adequately outline which data would be shared with third parties or what it would be used for. The onus is now on EU and UK authorities to act to put an end to them.
The social media giant said the number of government demands for user data increased by 16% to 128,617 demands during the first half of this year compared to the second half of last year.
That’s the highest number of government demands it has received in any reporting period since it published its first transparency report in 2013.
The U.S. government led the way with the most number of requests — 50,741 demands for user data resulting in some account or user data given to authorities in 88% of cases. Facebook said two-thirds of all the U.S. government’s requests came with a gag order, preventing the company from telling the user about the request for their data.
But Facebook said it was able to release details of 11 so-called national security letters (NSLs) for the first time after their gag provisions were lifted during the period. National security letters can compel companies to turn over non-content data at the request of the FBI. These letters are not approved by a judge, and often come with a gag order preventing their disclosure. But since the Freedom Act passed in 2015, companies have been allowed to request the lifting of those gag orders.
The report also said the social media giant had detected 67 disruptions of its services in 15 countries, compared to 53 disruptions in nine countries during the second half of last year.
And, the report said Facebook also pulled 11.6 million pieces of content, up from 5.8 million in the same period a year earlier, which Facebook said violated its policies on child nudity and sexual exploitation of children.
The social media giant also included Instagram in its report for the first time, including removing 1.68 million pieces of content during the second and third quarter of the year.
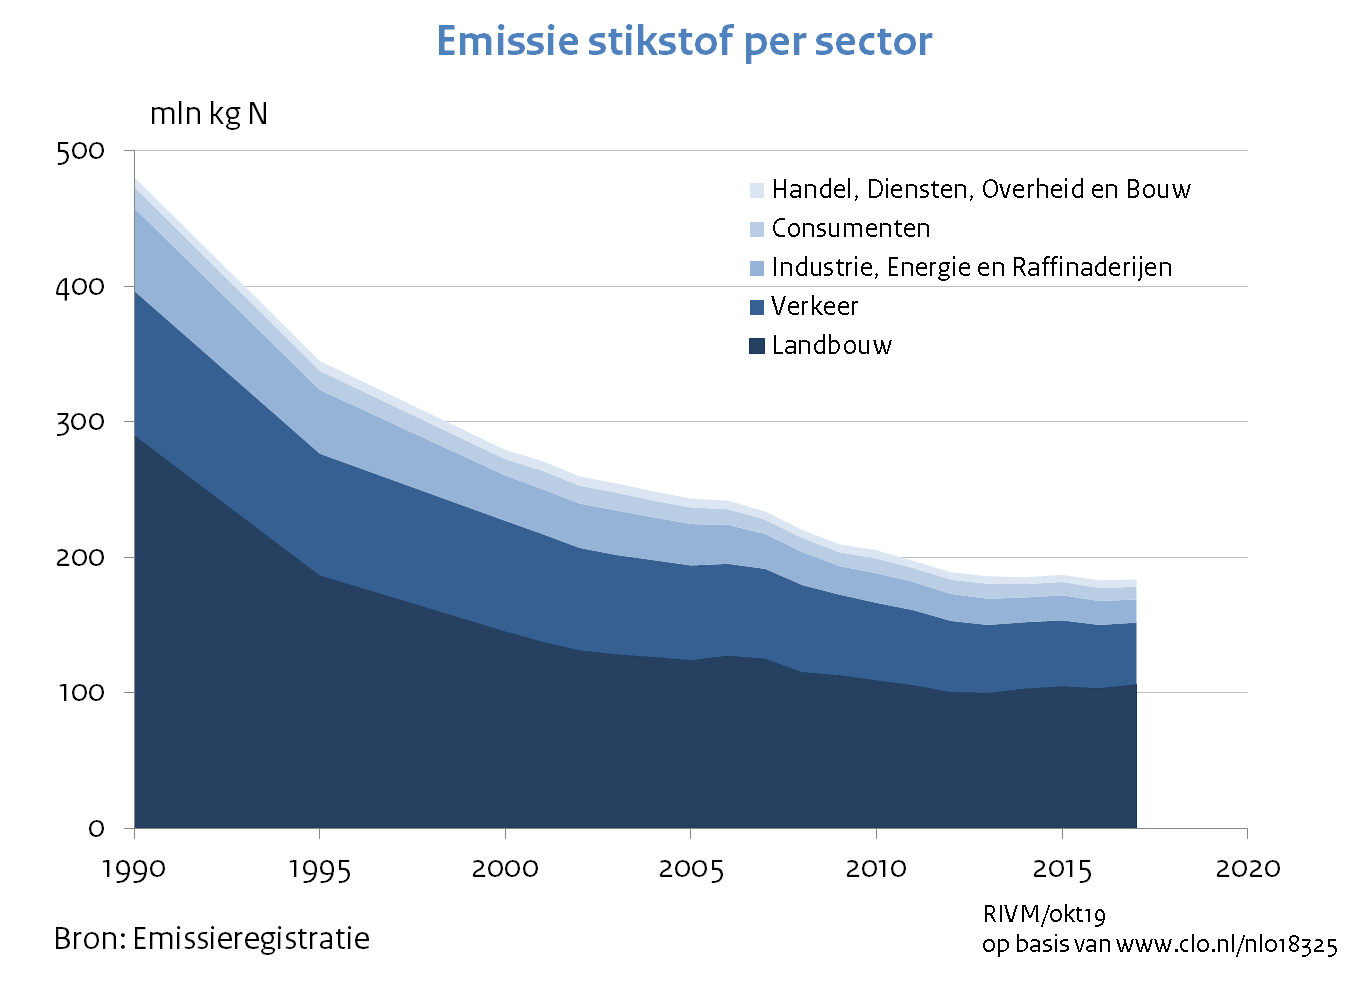
Right now, in the Netherlands there is talk about reducing the speed limit from 130kph to 100kph in order to comply to emissions goals set by the EU (and supported by NL) years ago. Because NL didn’t put into effect any necessary legislation years ago, this is now coming to bite NL in the arse and they are playing panic football.
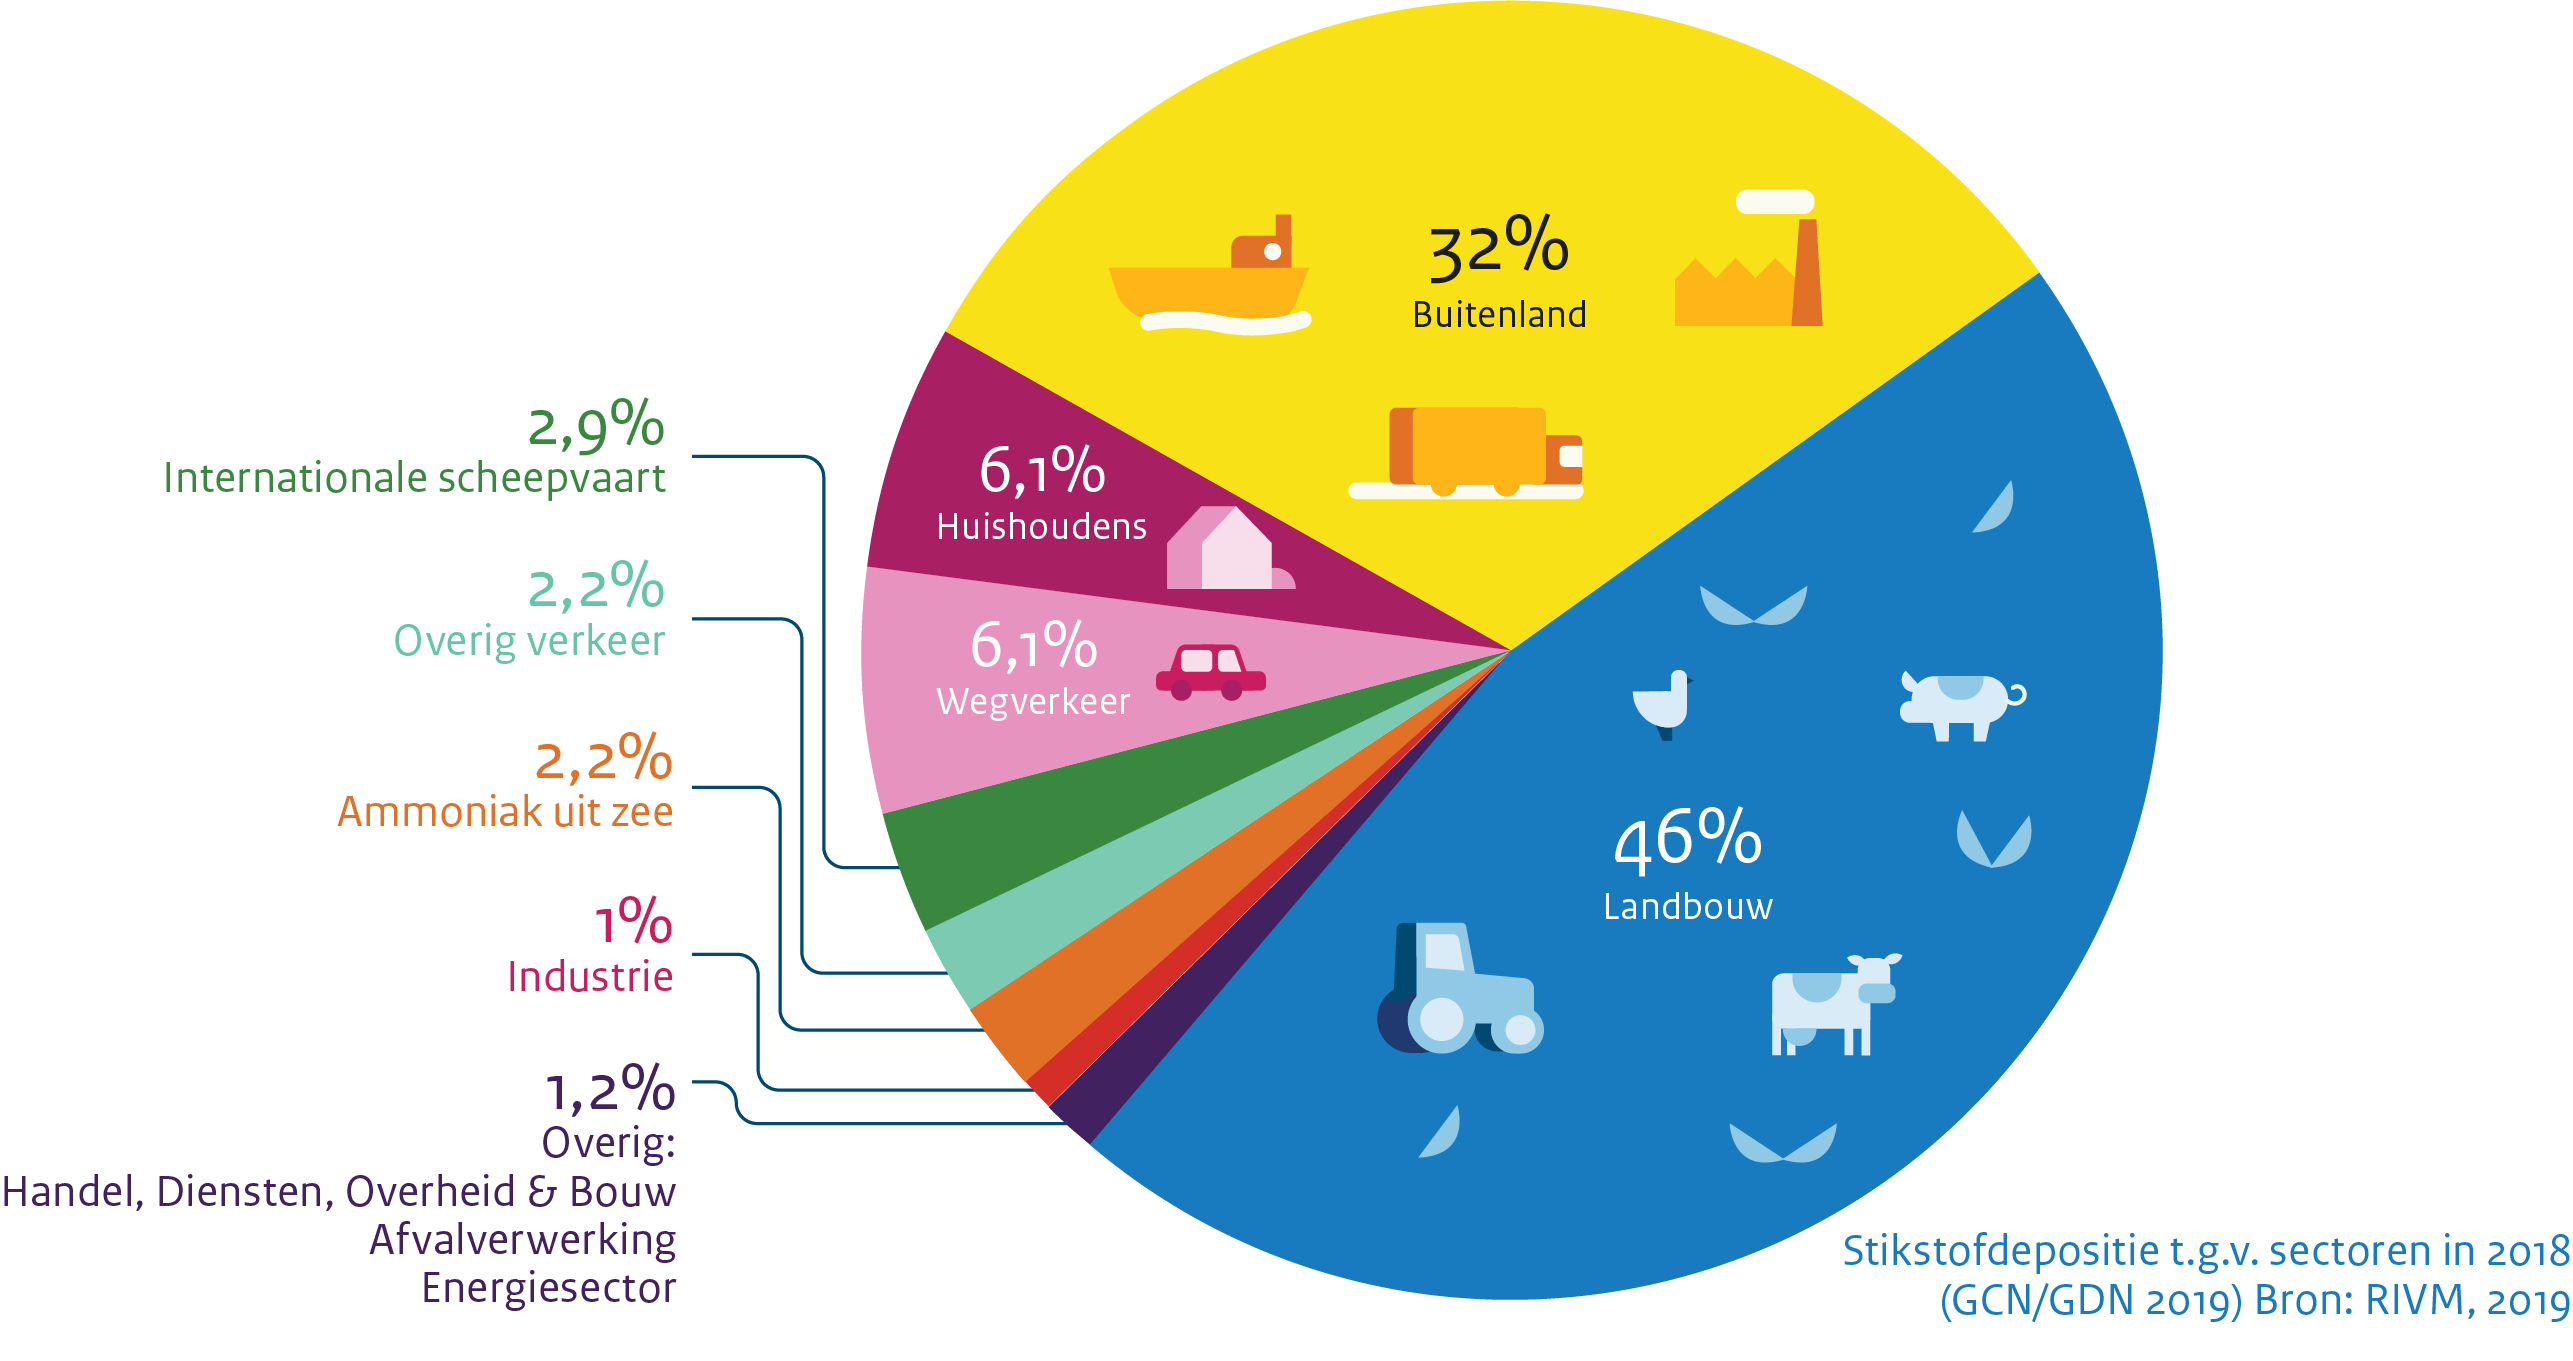
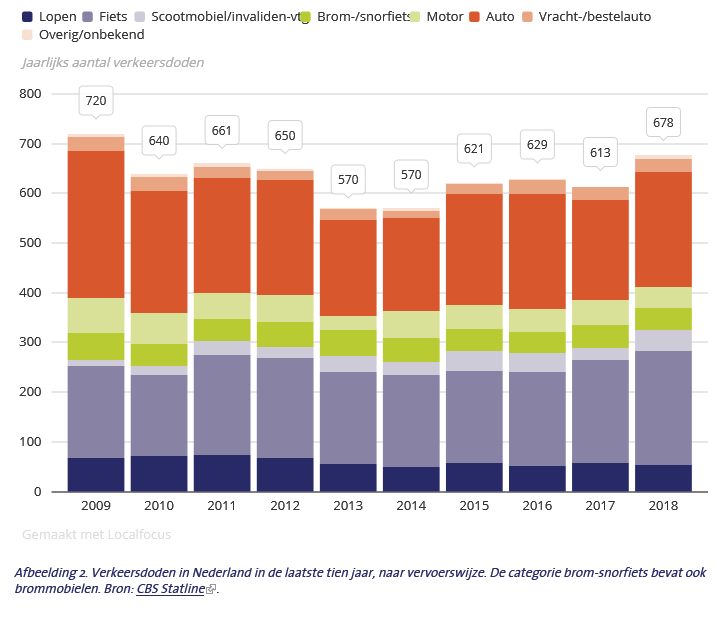
The Dutch institute for the environment shows pretty clearly where emissions are coming from:
As you can see it makes perfect sense to do something about traffic, as it causes 6.1% of emissions. Oh wait, there’s the farming sector: that causes 46% of emissions! Why not tackle that? Well, they tried to at first, but then the farmers did an occupy of the Hague with loads of tractors (twice) and all the politicians chickened out. Because nothing determines policy like a bunch of tractors causing traffic jams. Screw the will of the people anyway.
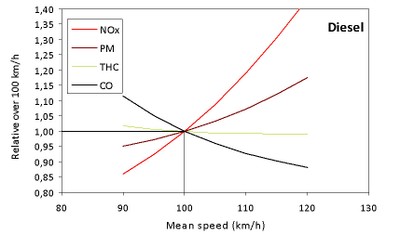
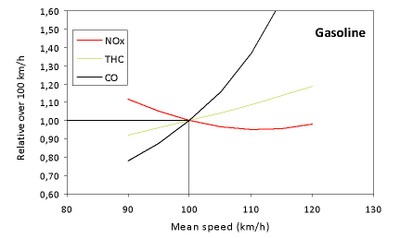
Note: emissions expressed
relative to their values at 100 km/h, for which the value ‘1’ is assigned.
Source: EMISIA – ETC/ACM
So reducing speed from 120-100 kph should result (for diesels) in an approx 15% decrease in particulate matter, a 40% decrease in nitrogen oxides but an increase in the amount of total hydrocarbons and carbon monoxides.
For gasoline powered cars the it’s a 20% decrease in total hydrocarbons, which means that in NL, we can knock down the 6.1% of the pie generated by cars to around 4%. Yay. We don’t win much.
Now about traffic flow, because that’s what I’m here for. The Dutch claim that lowering the speed limit will decrease the amount of time spent in traffic jams. Here’s an example of two experts saying so in BNN Vara’s article Experts: Door verlaging maximumsnelheid ben je juist sneller thuis
However, if you look at their conclusion, they come straight out of one of just two studies commonly used by seemingly everyone:
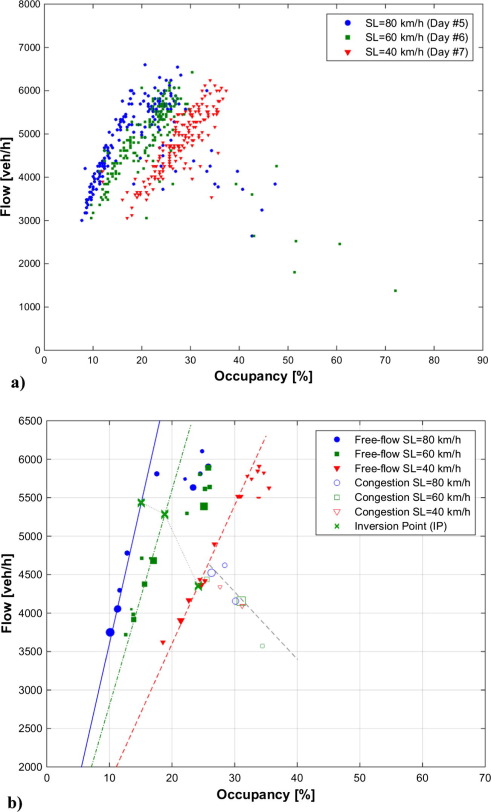
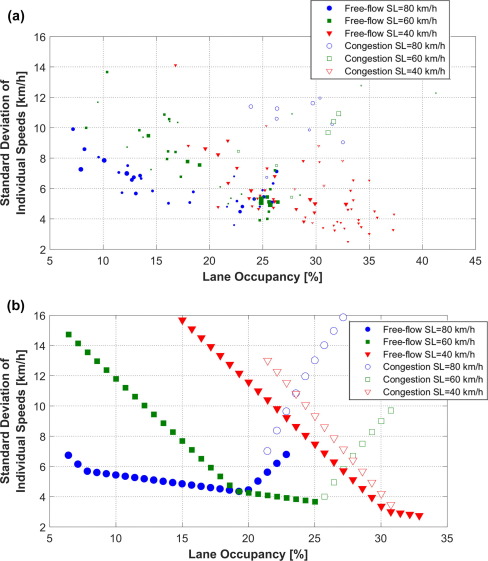
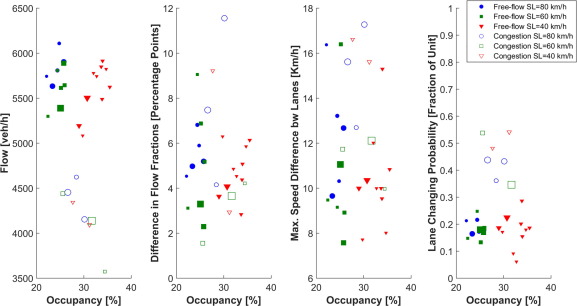
It is confirmed that the lower the speed limit, the higher the occupancy to achieve a given flow. This result has been observed even for relatively high flows and low speed limits. For instance, a stable flow of 1942 veh/h/lane has been measured with the 40 km/h speed limit in force. The corresponding occupancy was 33%, doubling the typical occupancy for this flow in the absence of speed limits. This means that VSL strategies aiming to restrict the mainline flow on a freeway by using low speed limits will need to be applied carefully, avoiding conditions as the ones presented here, where speed limits have a reduced ability to limit flows. On the other hand, VSL strategies trying to get the most from the increased vehicle storage capacity of freeways under low speed limits might be rather promising. Additionally, results show that lower speed limits increase the speed differences across lanes for moderate demands. This, in turn, also increases the lane changing rate. This means that VSL strategies aiming to homogenize traffic and reduce lane changing activity might not be successful when adopting such low speed limits. In contrast, lower speed limits widen the range of flows under uniform lane flow distributions, so that, even for moderate to low demands, the under-utilization of any lane is avoided.
There are a few problems with this study: First, it’s talking about speed limits of 40, 60 and 80 kph. Nothing around the 100 – 130kph mark. Secondly, the data in the graphs actually shows a lower occupancy with a higher speed limit – which is not their conclusion!
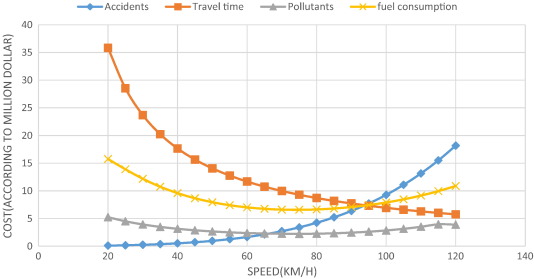
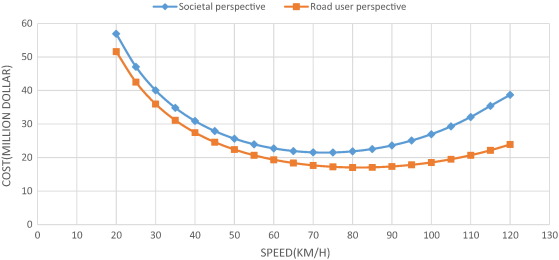
This paper aims to evaluate optimal speed limits in traffic networks in a way that economized societal costs are incurred. In this study, experimental and field data as well as data from simulations are used to determine how speed is related to the emission of pollutants, fuel consumption, travel time, and the number of accidents. This paper also proposes a simple model to calculate the societal costs of travel and relate them to speed. As a case study, using emission test results on cars manufactured domestically and by simulating the suburban traffic flow by Aimsun software, the total societal costs of the Shiraz-Marvdasht motorway, which is one of the most traversed routes in Iran, have been estimated. The results of the study show that from a societal perspective, the optimal speed would be 73 km/h, and from a road user perspective, it would be 82 km/h (in 2011, the average speed of the passing vehicles on that motorway was 82 km/h). The experiments in this paper were run on three different vehicles with different types of fuel. In a comparative study, the results show that the calculated speed limit is lower than the optimal speed limits in Sweden, Norway, and Australia.
(Emphasis mine)
It’s a compelling study with great results, which also include accidents.
In a multi-lane motorway divided by a median barrier in Sweden, the optimal speed is 110 km/h. The speed limit is 110 km/h and the current average speed is 109 km/h. In Norway, the optimal speed from a societal perspective is 100 km/h and the speed limit is 90 km/h. The current average speed is 95 km/h [2]. In Australia, the optimum speeds on rural freeways (dual carriageway roads with grade-separated intersections) would be 110 km/h [3]. Table 3 compares the results in Elvik [2] and Cameron [3] with those of the present study.
Table 3. Optimal speed in Norway, Sweden, Australia, and Iran. Source for columns 2 and 3: Elvik [2]. Source for column 4: Cameron [3].
Norway
Sweden
Australia
Iran
Optimal speed limits (km/h) according to societal perspective
100
110
110
73
Optimal speed limits (km/h) according to road user perspective
110
120
–
82
Current speed limits (km/h)
90
110
110
110
Current mean speed of travel (km/h)
95
109
–
82
There is a significant difference between the results in Iran and those in Sweden, Norway, and Australia; this difference results from the difference in the costs between Iran and these three countries. Also, the functions of fuel consumption and pollutant emission are different.
If you look at the first graph, you can be forgiven for thinking that the optimum speed is 95 kph, as Ruud Horman (from the BNN Vara piece) seems to think. However, as the author of this study is very careful to point out, it’s a very constrained study and there are per country differences – these results are only any good for a very specific highway in a very specific country.
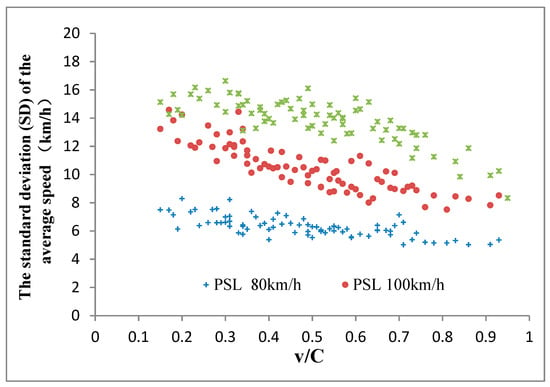
They come out with a whole load of pretty pictures based on the following graph:
x= intensity, y= speed.
There are quite a lot of graphs like this. So, the speed limit is 120kph (red dots) and the inttesity is 6000 (heavy) then the actual speed is likely to be around 100 kph op the A16. However if the speed limit is 130 kph with the same intensity – oh wait, it doesn’t get to the same intensity. You seem to have higher intensities more often with a speed limit of 120 kph. But if we have an intensity of around 3000 (which I guess is moderate) then you see that quite often the speed is 125 with a speed limit of 130 and around 100 with a speed limit of 120. However, with that intensity you see that there are slightly more datapoints at around 20 – 50 kph if your speed limit is 130kph than if it’s 120kph.
Oddly enough, they never added data from 100kph, of which there were (and are) plenty of roads. They also never take into account variable speed limits. The 120kph limit is based on data taken in 2012 and the 130kph limit is based on data from 2018.
Their conclusion – raising the speed limit wins you time when the roads are quiet and puts you into a traffic jam when the roads are busy – is spurious and lacks the data to be able to support it.
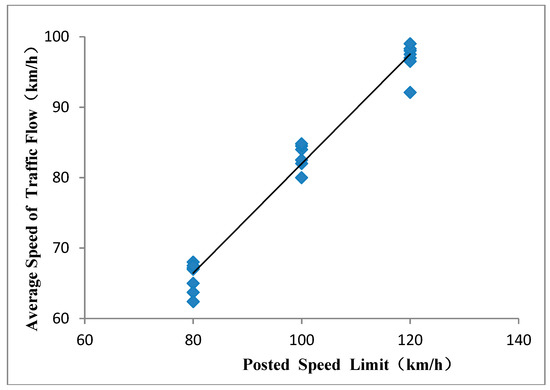
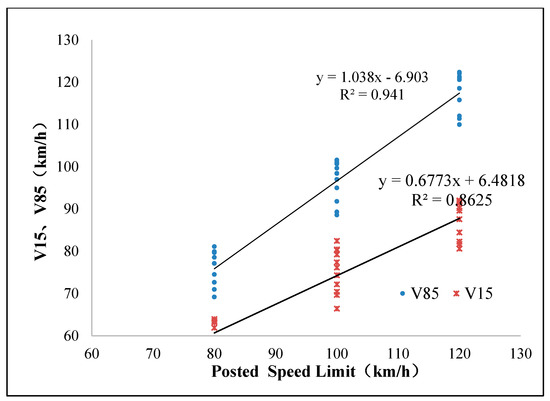
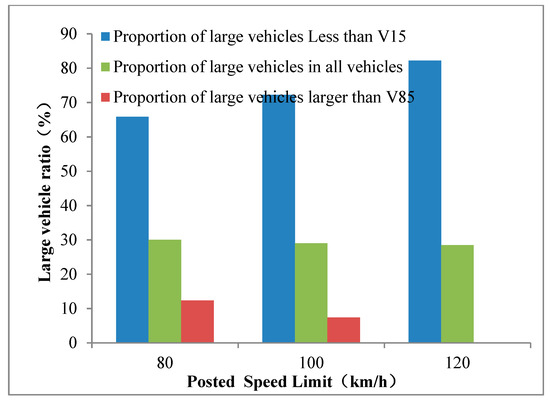
The conclusion is pretty tough reading but the graphs are quite clear
What they are basically saying is: we researched it pretty well and we had a look at the distribution of vehicle types. Basically, if you set a higher speed limit, people will drive faster. There is variability (the bars you see up and down the lines) so sometimes they will drive faster and somethims they will drive slower but they generally go faster on average with a higher speed limit.
Now one more argument is that the average commute is only about an hour per day. So if you go slower, you will only save a few minutes. The difference between 100 and 130kph is a 30% difference. Over an hour period (say 100 km), that’s a 21 minute difference, assuming you can travel that distance at that speed (what they call free flow conditions). Sure you’ll never get that, but over large distances you can come close. Anyway, say we halve that and say it’s a 10 minute difference. The argument becomes that this is just barely a cup of tea. But it’s 10 minutes difference EVERY WORKING DAY! Excluding weekends and holidays, you can expect to make that commute around 250 times per year, making your net loss 2500 minutes (at least), which is 41 hours or a full working week you now have to spend extra in the car!
– reducing the speed limit seems like poor populist policy to appease the farmers, look like Something is Being Done ™ and not actually get anything real to happen except piss off commuters.
According to a Verizon press release, the new Motorola Razr will clock in at the eye-popping price of $1,500 retail (still less than foldable competitors Samsung Galaxy Fold at $1,980 or more and Huawei Mate X at $2,420). Its 6.2-inch screen is ultrawide and the device packs a 16-megapixel main camera; Verizon added that when folded, the Razr’s “touchscreen Quick View external display lets you respond to notifications, take selfies, play your music, use Google Assistant, and more without having to flip open your phone.”
Graphic: Verizon
Graphic: Verizon
Slashgear has some more details on the device, including that the main display is a pOLED running at 2142 x 876 resolution while the Quick View display is a 2.7-inch OLED running at 600 x 800. Replying to text messages and emails via the external display requires using smart replies or dictation, though it will also function as a music controller and preview screen for the camera. It also has a Snapdragon 710 processor, 6GB of memory, and 128GB of storage, running Android Pie 9.
Graphic: Verizon
Downsides noted by Slashgear include no wireless charging and fast charging that caps out at 15W, as well as a 2,510 mAh battery. That’s considerably lower than the 3,000 mAh battery in Samsung’s flagship Galaxy S10 and newer iPhones, most models of which come in closer to or slightly over 3,000 mAh. Additionally, the new Razr follows other manufacturers’ leads by ditching the 3.5mm headphone jack for a USB-C connector, a decision widely reviled by consumers used to simply plugging in whatever headphones they have available at the moment. And despite Verizon’s big talk about their 5G network, the Razr will cap out at current-gen 4G LTE speeds.
The Air Force Research Laboratory demonstrated a new and ultra-responsive approach to turbine engine development with the initial testing of the Responsive Open Source Engine (ROSE) on Nov. 6, 2019, at Wright-Patterson Air Force Base.
The Aerospace Systems Directorate’s ROSE is the first turbine engine designed, assembled, and tested exclusively in-house. The entire effort, from concept initiation to testing, was executed within 13 months. This program responds to Air Force’s desire for rapid demonstration of new technologies and faster, less expensive prototypes.
“We decided the best way to make a low-cost, expendable engine was to separate the development costs from procurement costs,” said Frank Lieghley, Aerospace Systems Directorate Turbine Engine Division senior aerospace engineer and project manager. He explained that because the design and development were conducted in-house, the Air Force owns the intellectual property behind it. Therefore, once the engine is tested and qualified, the Air Force can forego the typical and often slow development process, instead opening the production opportunity to lower-cost manufacturers better able to economically produce the smaller production runs needed for new Air Force platforms.
The applications for this class of engine are many and varied, but the development and advancement of platforms that could make use of it has typically been stymied because the engines have been too expensive. Through this effort, AFRL hopes to lower the engine cost to roughly one fourth of the cheapest current alternative, an almost unheard-of price for such technology, thus enabling a new class of air vehicles that can capitalize on the less expensive engine.
[…]
by working closely with other AFRL organizations, including the Materials and Manufacturing Directorate and the Air Force Institute of Technology, the team leveraged internal expertise that helped advance the project. Additionally, by starting from scratch and performing all the work themselves, the AFRL team developed new tools and models that will be available for use in future iterations and new engine design projects.
[…]
“There’s not an Air Force engine fielded today whose technology can’t be traced back to Turbine Engine Division in-house work,” he said. “We’ll eventually hand this off to a manufacturer, but this one is all AFRL on the inside.”
The rise of the internet and the advent of social media have fundamentally changed the information ecosystem, giving the public direct access to more information than ever before. But it’s often nearly impossible to distinguish between accurate information and low-quality or false content. This means that disinformation — false or intentionally misleading information that aims to achieve an economic or political goal — can become rampant, spreading further and faster online than it ever could in another format.
As part of its Truth Decay initiative, RAND is responding to this urgent problem. Researchers identified and characterized the universe of online tools developed by nonprofits and civil society organizations to target online disinformation. The tools in this database are aimed at helping information consumers, researchers, and journalists navigate today’s challenging information environment. Researchers identified and characterized each tool on a number of dimensions, including the type of tool, the underlying technology, and the delivery format.
When you’re scrolling through Facebook’s app, the social network could be watching you back, concerned users have found. Multiple people have found and reported that their iPhone cameras were turned on in the background while they were looking at their feed.
The issue came to light through several posts on Twitter. Users noted that their cameras were activated behind Facebook’s app as they were watching videos or looking at photos on the social network.
After people clicked on the video to full screen, returning it back to normal would create a bug in which Facebook’s mobile layout was slightly shifted to the right. With the open space on the left, you could now see the phone’s camera activated in the background.
This was documented in multiple cases, with the earliest incident on Nov. 2.
It’s since been tweeted a couple other times, and CNET has also been able to replicate the issue.
John de Mol has successfully sued FB and forced them to remove fake ads in which it seems he endorses bitcoins and other cryptocurrencies (he doesn’t). They will not be allowed in the future either and FB must give him the details of the parties who placed the adverts on FB. FB is liable for fines up to EUR 1.1 million if they don’t comply.
Between Oktober 2018 and at least March 2019 a series of fake ads were placed on FB and Instagram that had him endorsing the crypto. He didn’t endorse them at all and not only that, they were a scam: the buyers never received any crypto after purchasing from the sites. The scammers received at least EUR 1.7 million.
The court did not accept FB’s argument that they are a neutral party just passing on information. The court argues that FB has a responsibility to guard against breaches of third party rights. After John de Mol had contacted FB and the ads decreased drastically in frequency shows the court that it is well within FB’s technical possibilities to guard against these breaches.
The first human vaccine against the often-fatal viral disease Ebola is now an official reality. On Monday, the European Union approved a vaccine developed by the pharmaceutical company Merck, called Ervebo.
The stage for Ervebo’s approval was set this October, when a committee assembled by the European Medicines Agency (EMA) recommended a conditional marketing authorization for the vaccine by the EU. Conditional marketing authorizations are given to new drugs or therapies that address an “unmet medical need” for patients. These drugs are approved on a quicker schedule than the typical new drug and require less clinical trial data to be collected and analyzed for approval.
In Ervebo’s case, though, the data so far seems to be overwhelmingly positive. In April, the World Health Organization revealed the preliminary results of its “ring vaccination” trials with Ervebo during the current Ebola outbreak in the Democratic Republic of Congo. Out of the nearly 100,000 people vaccinated up until that time, less than 3 percent went on to develop Ebola. These results, coupled with earlier trials dating back to the historic 2014-2015 outbreak of Ebola that killed over 10,000 people, secured Ervebo’s approval by the committee.
“Finding a vaccine as soon as possible against this terrible virus has been a priority for the international community ever since Ebola hit West Africa five years ago,” Vytenis Andriukaitis, commissioner in charge of Health and Food Safety at the EU’s European Commission, said in a statement announcing the approval. “Today’s decision is therefore a major step forward in saving lives in Africa and beyond.”
Although the marketing rights for Ervebo are held by Merck, it was originally developed by researchers from the Public Health Agency of Canada, which still maintains non-commercial rights.
The vaccine’s approval, significant as it is, won’t tangibly change things on the ground anytime soon. In October, the WHO said that licensed doses of Ervebo will not be available to the world until the middle of 2020. In the meantime, people in vulnerable areas will still have access to the vaccine through the current experimental program. Although Merck has also submitted Ervebo for approval by the Food and Drug Administration in the U.S., the agency’s final decision isn’t expected until next year as well.
IT guru Bob Gendler took to Medium last week to share a startling discovery about Apple Mail. If you have the application configured to send and receive encrypted email—messages that should be unreadable for anyone without the right decryption keys—Apple’s digital assistant goes ahead and stores your emails in plain text on your Mac’s drive.
More frustrating, you can have Siri completely disabled on your Mac, and your messages will still appear within a Mac database known as snippets.db. A process known as suggested will still comb through your emails and dump them into this plaintext database. This issue, according to Gendler, is present on multiple iterations of macOS, including the most recent Catalina and Mojave builds.
“I discovered this database and what’s stored there on July 25th and began extensively testing on multiple computers with Apple Mail set up and fully confirming this on July 29th. Later that week, I confirmed this database exists on 10.12 machines up to 10.15 and behaves the same way, storing encrypted messages unencrypted. If you have iCloud enabled and Siri enabled, I know there is some data sent to Apple to help with improving Siri, but I don’t know if that includes information from this database.”
Consider keeping Siri out of your email
While Apple is currently working on a fix for the issues Gendler raised, there are two easy ways you can ensure that your encrypted emails aren’t stored unencrypted on your Mac. First, you can disable Siri Suggestions for Mail within the “Siri” section of System Preferences.
Screenshot: David Murphy
Second, you can fire up Terminal and enter this command:
Regardless of which option you pick, you’ll want to delete the snippets.db file, as disabling Siri’s collection capabilities doesn’t automatically remove what’s already been collected (obviously). You’ll be able to find this by pulling up your Mac’s drive (Go > Computer) and doing a quick search for “snippets.db.”
Screenshot: David Murphy
Apple also told The Verge that you can also limit which apps are allowed to have Full Disk Access on your Mac—via System Preferences > Security & Privacy > Privacy tab—to ensure that they can’t access your snippets.db file. You can also turn on FileVault, which will prevent your emails from appearing as plaintext within snippets.db.
A large-scale academic study that analyzed more than 53,000 product pages on more than 11,000 online stores found widespread use of user interface “dark patterns”– practices meant to mislead customers into making purchases based on false or misleading information.
The study — presented last week at the ACM CSCW 2019 conference — found 1,818 instances of dark patterns present on 1,254 of the ∼11K shopping websites (∼11.1%) researchers scanned.
“Shopping websites that were more popular, according to Alexa rankings, were more likely to feature dark patterns,” researchers said.
But while the vast majority of UI dark patterns were meant to trick users into subscribing to newsletters or allowing broad data collection, some dark patterns were downright foul, trying to mislead users into making additional purchases, either by sneaking products into shopping carts or tricking users into believing products were about to sell out.
Of these, the research team found 234 instances, deployed across 183 websites.
Below are some of the examples of UI dark patterns that the research team found currently employed on today’s most popular online stores.
1. Sneak into basked
Adding additional products to users’ shopping carts without their consent.
Prevalence: 7 instances across 7 websites.
Image: Arunesh et al.
2. Hidden costs
Revealing previously undisclosed charges to users right before they make a purchase.
Prevalence: 5 instances across 5 websites.
Image: Arunesh et al.
3. Hidden subscription
Charging users a recurring fee under the pretense of a one-time fee or a free trial.
Prevalence: 14 instances across 13 websites.
Image: Arunesh et al.
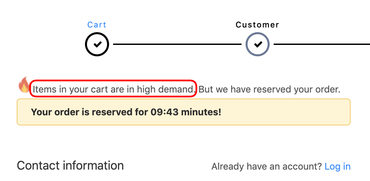
4. Countdown timer
Indicating to users that a deal or discount will expire using a counting-down timer.
Prevalence: 393 instances across 361 websites.
Image: Arunesh et al.
5. Limited-time message
Indicating to users that a deal or sale will expire will expire soon without specifying a deadline, thus creating uncertainty.
Prevalence: 88 instances across 84 websites.
Image: Arunesh et al.
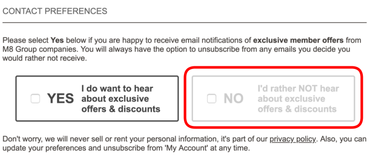
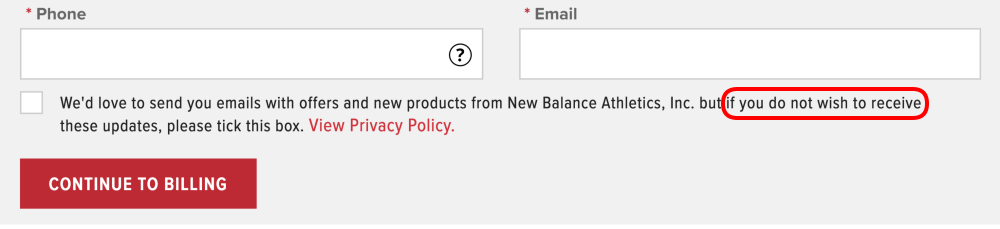
6. Confirmshaming
Using language and emotion (shame) to steer users away from making a certain choice.
Prevalence: 169 instances across 164 websites.
Image: Arunesh et al.
7. Visual interference
Using style and visual presentation to steer users to or away from certain choices.
Prevalence: 25 instances across 24 websites.
Image: Arunesh et al.
8. Trick questions
Using confusing language to steer users into making certain choices.
Prevalence: 9 instances across 9 websites.
Image: Arunesh et al.
9. Pressured selling
Pre-selecting more expensive variations of a product, or pressuring the user to accept the more expensive variations of a product and related products.
Prevalence: 67 instances across 62 websites.
Image: Arunesh et al.
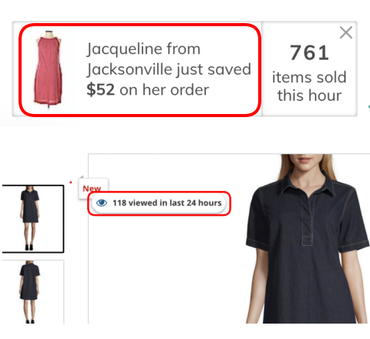
10. Activity messages
Informing the user about the activity on the website (e.g., purchases, views, visits).
Prevalence: 313 instances across 264 websites.
Image: Arunesh et al.
11. Testimonials of uncertain origin
Testimonials on a product page whose origin is unclear.
Prevalence: 12 instances across 12 websites
Image: Arunesh et al.
12. Low-stock message
Indicating to users that limited quantities of a product are available, increasing its desirability.
Prevalence: 632 instances across 581 websites.
Image: Arunesh et al.
13. High-demand message
Indicating to users that a product is in high-demand and likely to sell out soon, increasing its desirability
Prevalence: 47 instances across 43 websites.
Image: Arunesh et al.
14. Hard to cancel
Making it easy for the user to sign up for a recurring subscription but cancellation requires emailing or calling customer care.
Prevalence: 31 instances across 31 websites.
Image: Arunesh et al.
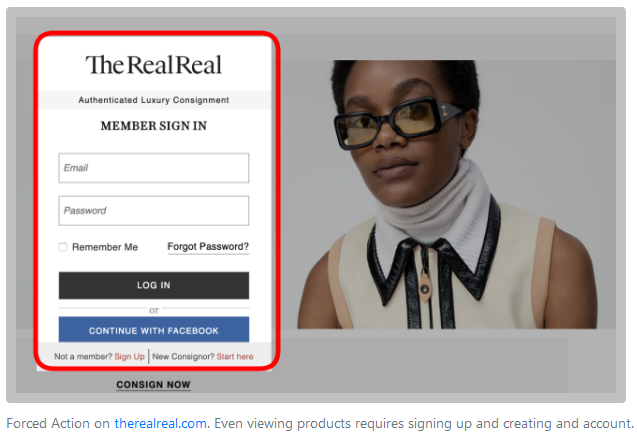
15. Forced enrollment
Coercing users to create accounts or share their information to complete their tasks.
Prevalence: 6 instances across 6 websites.
Image: Arunesh et al.
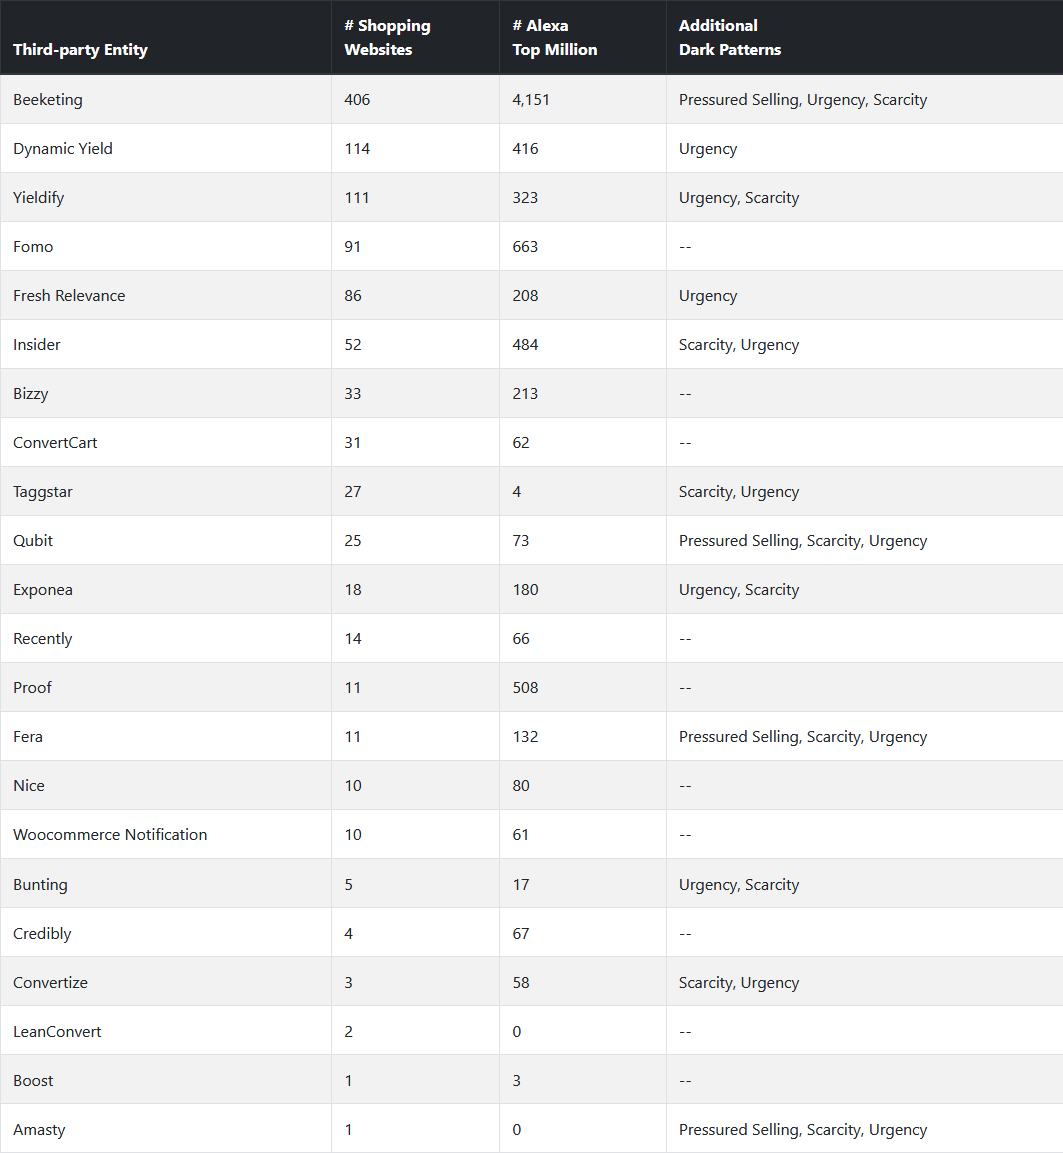
The research team behind this project, made up of academics from Princeton University and the University of Chicago, expect these UI dark patterns to become even more popular in the coming years.
One reason, they said, is that there are third-party companies that currently offer dark patterns as a turnkey solution, either in the form of store extensions and plugins or on-demand store customization services.
The table below contains the list of 22 third-parties that the research team identified following their study as providers of turnkey solutions for dark pattern-like behavior.